Trading education · Trading strategies
Trend-Following Strategy: Pullbacks, Rules and Failures
Study an EMA-filtered forex pullback example with explicit timeframe handling, entry, stop, target, time exit and sideways-market failure conditions.
Explore the guide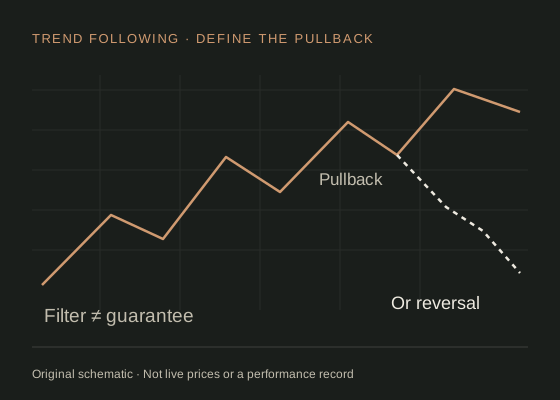
The short answer
Trend following tests whether a directional move persists. A filter can define the context, but entry timing and risk still need separate rules. Trends can end abruptly, and an average that identifies a trend will necessarily react to historical prices.
Give the filter and the trigger different jobs.
This is an original, unvalidated study specification. Its numerical settings are teaching choices, not optimised parameters, personalised advice or evidence of profitability. All prices below are hypothetical.
The hypothesis is that an upward context on an hourly chart can persist after a smaller pullback. The context filter is an EMA relationship; the entry trigger is a later completed price observation. Fidelity: exponential moving averages explains the average itself. It does not validate this combination of rules.
A filter reduces the set of eligible observations. It does not prove those remaining are favourable. If the filter identifies a trend late, the first eligible pullback may occur just as the move is ending.
An example long-only pullback specification.
| Component | Teaching rule |
|---|---|
| Context | Using completed hourly bid closes, require EMA(20) above EMA(50), and EMA(20) above its value five completed hourly bars earlier. |
| Candidate | The first completed fifteen-minute bid candle whose low touches or passes below the latest completed hourly EMA(20), while its close remains above that hourly EMA(50). Freeze its high and low. |
| Trigger and expiry | Within the next three completed fifteen-minute bars, require a close above the candidate high while the latest completed hourly filter still holds. Otherwise expire the candidate. |
| Entry and exclusions | Buy at the next available ask. Skip if spread exceeds 2 pips, ask is more than 5 pips above the candidate high, or entry is within 15 minutes of a pre-scheduled high-impact EUR/USD-currency event. |
| Exits | Initial bid stop: candidate low minus 2 pips. Bid target: entry ask plus twice the initial price distance. Also exit on the next available bid after a completed hourly EMA(20) crosses below EMA(50), or eight hours after entry, whichever exit occurs first. |
| Exposure | One open position maximum. After exit, wait for a newly completed candidate candle; do not reuse the old candidate. Skip missing quotes or unavailable calendar history. |
For this exercise, process only one candidate at a time. A failed or skipped candidate is not relabelled using a later low. No entries are allowed when the context filter is false. The stop stays at its original level; a trailing-stop variation would need separate rules.
A pullback example in numbers.
Assume the filter is true, the candidate high is 1.1048 and its low is 1.1022. A permitted later candle closes above 1.1048, and the next available ask is 1.1050. The initial bid stop is 1.1020, creating a 30-pip price distance. The 2R model target is 1.1110.
At a hypothetical USD 1 per pip, the model price loss is USD 30 and price gain USD 60. With USD 0.70 additional round-trip commission and exact fills, those become a USD 30.70 loss and USD 59.30 gain. The gross 2:1 ratio is therefore different from the net payoff ratio.
An early time exit or filter exit can produce a smaller gain, smaller loss or another result. Do not assume every winner reaches 2R or every loser loses exactly 1R. A report should use actual modelled exits, not replace them with the headline target.
Where this hypothesis can fail.
A sideways market can temporarily satisfy the hourly filter and then reverse, creating repeated losing pullbacks. A strong trend can also continue without touching the chosen average, giving no candidate at all. A deeper reversal can pass straight through the stop.
News can invalidate a smooth historical pattern in seconds. The event exclusion is only a rule about known scheduled releases; it does not remove unscheduled headlines or guarantee normal execution outside the window.
Two illustrative losses in succession are not, by themselves, proof the method is broken. Two wins are not proof it works. Evaluate the full outcome distribution and drawdown behaviour under a fixed specification.
Avoid a hidden higher-timeframe lookahead.
At 10:15, an hourly candle scheduled to finish at 11:00 is not complete. This specification uses only the last completed hourly inputs when evaluating a fifteen-minute candidate. Using the final 11:00 hourly value at 10:15 would give the model future information.
Store the timestamps of both the lower-timeframe decision and the higher-timeframe input it used. Declare the candle alignment and timezone. An hourly bar beginning at 10:00 is not interchangeable with a custom hourly bar beginning at 10:30.
Use enough warm-up data for both averages and document their seed convention. The EMA versus SMA guide explains why different initialisation can change early values.
Work through it yourself.
Record the plan, execution assumptions, outcome and lessons from a practice trade.
Download trading-review worksheet PDF · 2 pagesFree to download without registering. Practice examples explain the method; they do not establish a profitable strategy.
Common trend-following questions.
Does price above an EMA mean I should buy?
No. That is one relationship to historical prices. A complete plan needs context, a trigger, execution assumptions and a risk process, and still needs validation.
Why not keep widening the stop until the trend returns?
That changes the initial exposure and invalidates the original risk calculation. A study must state any stop changes before the outcome, rather than improvising them to avoid a realised loss.
Will a longer moving average remove false signals?
It changes responsiveness and can delay observations. It cannot guarantee that a filtered move will continue.
Sources & assumptions.
Prepared by InsomniCapital; see our editorial approach. Sources checked on 2 October 2026. Schematics and hypothetical calculations are labelled educational illustrations. Historical observations identify their source, dates and method separately. Neither is a live quote, trade recommendation or reported trading result.
- Fidelity: exponential moving averages.
- Fidelity: simple moving averages.
- Investor.gov: order execution risks (securities examples).
Educational information only, not personalised investment advice. Leveraged trading carries a high risk of loss. Read our risk disclosure. InsomniCapital has an Axi affiliate relationship and may receive compensation for qualifying referrals. References are not endorsements of this guide.