Historical FX research
EUR/USD and GBP/USD Correlation: A 2024 Reference-Rate Study
Original analysis of EUR/USD and GBP/USD daily reference returns in 2024, with quarter comparisons, volatility, downloadable results and a reproducible method.
Historical FX research · Published
Across 255 paired return observations, EUR/USD and derived GBP/USD had a Pearson correlation of 0.7637. Within-quarter estimates ranged from 0.6251 to 0.8726. This study describes a frozen 2024 ECB reference-rate sample; it is not a current market assessment or a forecast.
Original analysis by InsomniCapital. The observation period or hypothetical assumptions below determine what this study can establish; its publication date does not make the inputs live.
The relationship changed with the observation window.
The full available 2024 sample shows positive co-movement between the two pairs’ consecutive-reference log returns. Its correlation is 0.7637, while annualised sample volatility is 5.95% for EUR/USD and 5.91% for GBP/USD. Similar full-window volatility does not mean the paths, drawdowns or economic exposures were identical.
Q1 has the highest within-quarter correlation, 0.8726, and Q3 the lowest, 0.6251. Q4 has the highest annualised volatility of these four quarter samples for both pairs: 7.09% and 6.48% respectively. These are descriptive comparisons of specified windows, not tests establishing a permanent change in the relationship.
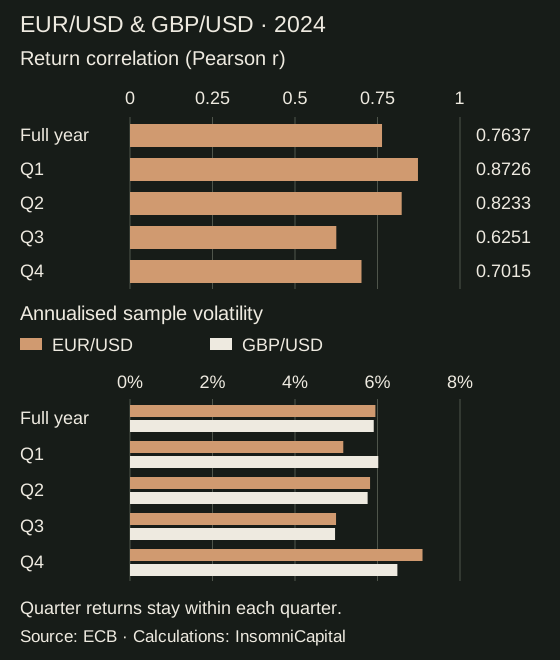
| Sample | Included dates | Observations / returns | Return correlation | EUR/USD volatility | GBP/USD volatility |
|---|---|---|---|---|---|
| Full year | 2024-01-02 to 2024-12-31 | 256 / 255 | 0.7637 | 5.95% | 5.91% |
| Q1 | 2024-01-02 to 2024-03-28 | 63 / 62 | 0.8726 | 5.17% | 6.02% |
| Q2 | 2024-04-02 to 2024-06-28 | 63 / 62 | 0.8233 | 5.82% | 5.76% |
| Q3 | 2024-07-01 to 2024-09-30 | 66 / 65 | 0.6251 | 4.99% | 4.97% |
| Q4 | 2024-10-01 to 2024-12-31 | 64 / 63 | 0.7015 | 7.09% | 6.48% |
“Full year” means the available observations from 2 January to 31 December 2024. It excludes the move from the final 2023 observation to the first 2024 observation. Publication on 2 October 2026 does not make this a study of current conditions.
One reference source and an explicit cross-rate.
The input is the reviewed ECB dataset used by our historical forex lab. It has 256 dates with USD, GBP and JPY quoted per one EUR. This study uses the USD and GBP columns; JPY remains in the source download for consistency but does not enter these calculations.
We selected 2024 because it is the site’s existing reviewed full-year dataset. This is a convenience sample, with no search across years for a particular correlation outcome.
EUR/USD uses the USD-per-EUR observation directly. GBP/USD is derived on the same date by dividing USD per EUR by GBP per EUR. For example, hypothetical quotes of 1.10 USD per EUR and 0.88 GBP per EUR produce 1.25 USD per GBP. These are mathematical reference crosses, not prices available to buy or sell a particular quantity.
The ECB publishes reference observations for information and discourages their use for transactions. The dates do not identify intraday OHLC candles or a broker’s daily close. We preserve the published dates, including calendar gaps, and do not insert weekend, holiday or estimated observations.
Calculate returns inside each selected window.
- Select the full 2024 calendar window or one chronological calendar quarter, using inclusive date bounds.
- Derive both pair-rate series from matching source dates before calculating a statistic.
- For consecutive observations within that window, calculate r = ln(current rate ÷ previous rate).
- Calculate Pearson correlation from the two aligned return series after subtracting their respective means.
- Calculate each return series’ sample standard deviation using N − 1 in the denominator, then multiply by √252. Multiply by 100 only to express volatility as a percentage.
There are 255 full-window returns. The quarter samples contain 62, 62, 65 and 63 returns, totalling 252. The three transitions from 28 March to 2 April, 28 June to 1 July, and 30 September to 1 October belong to the full-window calculation but are deliberately absent from the within-quarter calculations.
The same convention applies to the first-to-last changes below. Quarter changes omit those boundary moves, so compounding the four displayed changes does not reconstruct the full-window change. A calendar gap remains one return interval. Annualisation assumes comparable observation intervals and makes no adjustment for elapsed days or serial dependence; it is a convention, not an observed annual outcome.
Keep correlation, movement and trading outcomes separate.
A correlation of 0.7637 does not mean that prices moved in the same direction on 76.37% of dates, or that a trade had that probability of success. It measures a linear relationship between centred log returns. Comparing price levels instead would answer a different question and can create misleadingly strong relationships between trending series.
Both pairs are quoted in USD, and the derived GBP/USD return contains the same USD-per-EUR component used for EUR/USD. Shared currency exposure matters when interpreting the association. The calculation does not isolate economic causes, remove common factors or establish an optimal hedge ratio.
| Sample | EUR/USD | GBP/USD |
|---|---|---|
| Full year | -5.18% | -0.91% |
| Q1 | -1.32% | -0.01% |
| Q2 | -0.41% | +0.62% |
| Q3 | +4.20% | +5.75% |
| Q4 | -6.29% | -5.98% |
Q3’s positive reference-rate changes and Q4’s negative changes are separate observations from their correlations. Positive correlation can coexist with both pairs falling. None of these changes includes position size, leverage, entry timing or costs, so they must not be presented as achievable account returns.
Reproduce the results and inspect the source boundary.
Download the 256-date source dataset and open it in the historical forex lab. Choose EUR/USD and GBP/USD. The full window is 1 January–31 December 2024; repeat with January–March, April–June, July–September and October–December bounds. The lab reports the actual first and last dates included.
The study CSV contains all five result rows; its volatility and change columns are explicitly percentages. The JSON retains decimal ratios, observation counts, requested bounds, source hashes and formulas. We round visible correlation to four decimals and visible percentages to two; calculations and downloadable results retain greater precision.
The source dataset is frozen by its SHA-256 checksum. A later source revision requires a new review rather than silently changing these results. To regenerate the study assets from the reviewed project files, run node scripts/research-fx-study.mjs. The calculation uses the same reviewed rates and statistical definitions as the lab.
What this sample cannot establish.
One year and four relatively short quarter samples cannot establish a stable future correlation or volatility level. We report no confidence intervals, significance tests or out-of-sample validation. A difference between two displayed estimates is not, by itself, evidence of a statistically significant regime change.
Reference observations omit bid/ask spreads, slippage, financing, executable liquidity and intraday variation. Opposite positions in these pairs would still have residual currency exposure and execution risk. The findings therefore provide neither a hedge guarantee nor a trading strategy.
There is no current news interpretation, forecast or live price feed in this study. Changing the data source, observation time, return convention or window boundaries may change the estimates. Use the backtesting guide to separate an exploratory observation from a rule that has actually been tested, and keep the EUR/USD centre’s product and execution assumptions in view.
Publication and corrections
- — Initial publication.
No corrections recorded for this version. Substantive corrections should describe the changed claim, its effect on the findings and any replacement download. Read our research and corrections method.
Downloads and primary sources
- Download all five sample results (CSV)
- Download results and methodology (JSON)
- Open the original comparison chart (SVG)
The downloads contain the inputs, units or methods required to understand the results. Check the source period and assumptions before reusing them.
- European Central Bank: euro reference-rate purpose and publication convention
- ECB Data Portal: official 2024 USD, GBP and JPY source query
- ECB Data Portal: API filters, series keys and CSV examples
Source checks and arithmetic checks do not establish a profitable trading strategy. No independent professional review, live trading result or forecast is claimed. Read the risk disclosure.