Trading education · Strategy research
Backtesting Basics: Data, Costs, Bias and Honest Results
Build a reproducible trading backtest with clear rules, point-in-time data and execution costs. Understand look-ahead bias, overfitting and result limits.
The short answer
A backtest applies a specified decision and execution model to historical data. It can reveal how that model behaved under its assumptions; it cannot recreate every live fill or guarantee future results. Preserve data timing, failed candidates, costs and development history so a strong-looking result can be examined honestly.
Write the model before running it.
Start with a question and a complete specification: instrument, data feed, timeframe, signal timing, entry instruction, size, exits, expiry and costs. “Buy a breakout” is incomplete. Does a wick qualify, must a bar close, and at what later executable price can the order enter?
QuantConnect: research design and overfitting discusses research design and overfitting. Use a written hypothesis and change log rather than treating its platform-specific heuristics as universal pass/fail limits. Our strategy framework shows the components of a reproducible specification.
Record skipped candidates, rejected orders and unfilled limits as well as completed trades. Otherwise the backtest can quietly become a collection of the setups that happened to execute favourably.
Match the data to the question.
Check time zone, timestamp meaning, bid/ask coverage, gaps, duplicate records and price units. A daily reference rate is not an OHLC candle or an executable quote. It can illustrate reference observations, as in our historical zone example, but cannot establish an intraday stop or entry fill.
With bar data, the high and low do not reveal their full sequence. If both stop and target are crossed in one bar, use suitable finer data or a declared conservative rule. Do not choose whichever ordering improves the result. A limit-price touch also does not prove that enough quantity was available to fill the order.
For other markets, data preparation can introduce further issues, including survivorship, corporate-action adjustments and futures contract rolls. Retain the original source and transformation notes so a later audit can reproduce the series you actually tested.
Prevent future information entering earlier decisions.
A signal using a completed hourly close is not known before that hour ends. A swing rule requiring two later bars cannot enter at the earlier swing timestamp. Economic figures subsequently revised may also differ from the initial figures available to participants.
QuantConnect: optimisation and look-ahead bias discusses look-ahead bias. Audit the time at which each input becomes available, not just the date printed beside it. Shifting a label back to the visually attractive candle can create an impossible trading advantage.
As a practical test, pause the simulation at each decision and list the records it could access. Features, portfolio state and order assumptions should depend only on information available then. A beautiful equity curve does not excuse a timing violation.
Reconcile a small illustrative ledger.
Consider an invented 20-trade ledger: 12 winners each gain USD 30 on price and eight losers each lose USD 40. Gross gains are USD 360, gross losses USD 320 and gross net P/L USD 40. The win rate is 60%, but that alone does not describe the economics.
Apply a separate USD 3 round-trip cost to every trade. Total additional costs are USD 60, so net P/L becomes −USD 20, or −USD 1 per trade. Net winners are USD 27 each and net losers USD 43 each. Net profit factor is 324 ÷ 344, approximately 0.942.
This is arithmetic, not a historical strategy result. The aggregate counts do not reveal maximum drawdown: the ordering and equity path are missing. Nor do they show duration, overlapping exposure or whether the assumed fills were feasible. Executable prices that already include spread should not have the same spread subtracted again.
Separate development from evaluation.
Trying many rules and keeping only the best historical result creates a selection problem. Bailey, Borwein, López de Prado and Zhu: The Probability of Backtest Overfitting studies backtest overfitting formally. It does not provide a blanket guarantee that a simple train/test split makes a trading model reliable.
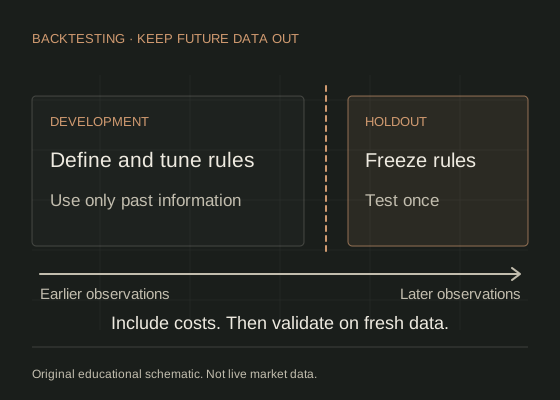
Choose a development period and preserve a later evaluation period before tuning. Freeze the specification before examining that later result. Once its outcomes inform another change, it has become part of development and should no longer be described as untouched.
Walk-forward research can repeat a documented fit-then-test process across time. Record every attempted variant, chosen window and abandoned model. Nearby parameter settings, different periods and adverse cost assumptions can expose fragility; they do not certify a strategy for future markets.
Report evidence with enough context to challenge it.
- Data source, period, sample exclusions and preparation steps.
- Exact rules, development history and evaluation boundaries.
- Trade count, exposure, net outcomes and the complete equity path.
- Drawdown definition, duration and recovery assumptions.
- Costs, slippage, financing, conversion and order-fill rules.
- Failures, ambiguous bars and sensitivity to reasonable alternatives.
A short or highly clustered sample can give an unstable estimate. There is no universal trade count that proves an edge. Later demo observation can reveal operational discrepancies, while live execution can differ again; neither turns historical results into a promise.
Audit one rule without optimising it.
Take the illustrative breakout specification and translate ten paper cases into a ledger. Include a false break, no fill, gap and ambiguous stop/target bar. State the outcome rule for each before calculating totals.
Keep a copy of the unchanged specification, then repeat with one explicitly different cost assumption. Explain which results changed and why. This exercise checks modelling discipline, not profitability, and does not require connecting a trading account.
Common backtesting questions.
Does a profitable backtest prove the strategy works?
No. Data errors, timing mistakes, selection effects, unrealistic fills and changing conditions can all limit the result.
Can I use the same test period repeatedly?
You can inspect it, but once it influences rule choices it is part of development rather than an untouched evaluation.
Is the strategy with the highest past return automatically best?
No. Compare risk, sample quality, costs, fragility and how the strategy was selected, not just one headline return.
Sources & assumptions.
Prepared by InsomniCapital; see our editorial approach. Sources checked on 2 October 2026. Schematics and hypothetical calculations are labelled educational illustrations. Historical observations identify their source, dates and method separately. Neither is a live quote, trade recommendation or reported trading result.
- Bailey, Borwein, López de Prado and Zhu: The Probability of Backtest Overfitting.
- QuantConnect: research design and overfitting.
- QuantConnect: optimisation and look-ahead bias.
- Investor.gov: market, limit and stop orders (securities examples).
Educational information only, not personalised investment advice. Leveraged trading carries a high risk of loss. Read our risk disclosure. InsomniCapital has an Axi affiliate relationship and may receive compensation for qualifying referrals. References are not endorsements of this guide.