Trading education · Support & resistance
Support and Resistance: Zones, Timeframes and Retests
Learn to mark support and resistance zones consistently, compare timeframes and distinguish a break-and-retest from a failed breakout.
Explore the guide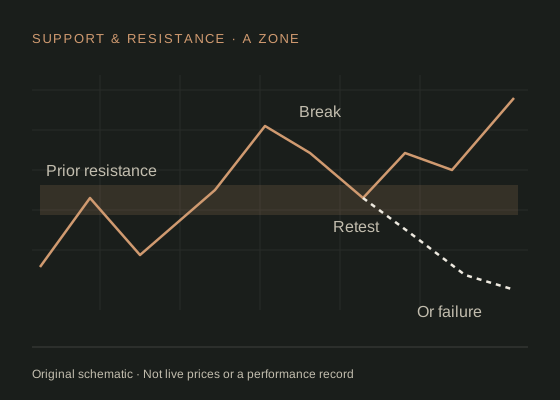
The short answer
Support and resistance are areas where price previously paused or changed direction. Mark them using a consistent rule and information available at the time. A later return is a new test of that area, not a guarantee it will hold.
Use an area with a stated purpose.
Support describes an area where a decline previously met enough buying to pause or reverse. Resistance describes an area where an advance stalled. Fidelity: support, resistance and role reversal explains the conventional idea that a broken area can later play the opposite role. Treat that as a possibility to observe, rather than a law of price behaviour.
A zone can be more honest than one exact line when several reactions have occurred at slightly different prices. The important discipline is consistency. Decide whether you are grouping closing prices, wick extremes or both; avoid widening the zone after an adverse move simply to claim it still held.
Round numbers, previous session extremes and completed swing points can be useful reference labels. None is automatically important just because it can be drawn. Too many overlapping zones make it impossible to distinguish an actionable observation from ordinary movement.
An example method for marking zones.
- Choose a context chart: for example, completed one-hour EUR/USD candles.
- Choose a lookback: use the last five completed trading sessions for this exercise.
- Identify distinct reactions: group nearby turning points that are separated by a meaningful move away.
- Write the boundaries: record the lowest and highest prices you included, along with the observation time.
- Limit clutter: retain the nearest relevant areas above and below price, and archive superseded zones.
These settings are an original learning exercise, not optimised parameters. A different pair, horizon or volatility regime may need a different definition. Compare alternative methods on separate samples rather than selecting the one that best explains a finished chart.
Reactions from a single long sideways patch are not necessarily independent tests. Ten candles touching an area within one consolidation are different from ten separate visits after sizeable moves away.
Give each timeframe a separate job.
One practical study design uses the higher timeframe to record location and a lower timeframe to describe the entry observation. Suppose the hourly chart contains a zone from 1.1000 to 1.1010. A five-minute candle can describe what happens inside it, but cannot make the hourly zone disappear merely by changing the zoom.
Write down whether a break is judged on the hourly close or the five-minute close. A five-minute close beyond the boundary can occur while the hourly candle is still forming. Those are different rules with different timing and should be tested separately.
More timeframes do not necessarily provide independent confirmation. They are often different aggregations of the same underlying price movement. Keep a small, explicit hierarchy so that contradictory observations are handled consistently.
A break-and-retest example, and its alternative.
Assume the 1.1000–1.1010 zone was marked as resistance before price reached it. An hourly candle then closes at 1.1020. Price later returns into the zone. Under a hypothetical rule, the retest becomes interesting only after a completed five-minute candle closes back above 1.1010.
A model entry at 1.1015, stop at 1.0995 and target at 1.1055 produce distances of 20 and 40 pips. The 2:1 gross ratio describes those chosen prices; costs lower the net ratio and an ordinary stop can slip. If the next relevant resistance were instead 1.1030, the available 15 pips would change the decision.
In the failure path, the retest does not hold: price closes below 1.1000 and continues lower. An alternative case never retests at all. Chasing that move is a different setup, so a retest-only study should record it as no trade rather than invent a fill.
Separate an explanation from evidence.
A finished chart makes its turning points easy to see. To evaluate a method, save a screenshot or data snapshot when each zone is first marked, before the later outcome. Store the timeframe, rule, boundary prices, expiry and any news filter with it.
Review how often price reaches a zone, how often your entry condition then occurs, and how the complete entry/exit process behaves after costs. Counting every bounce as a success ignores occasions when the planned order could not fill or the stop was hit first.
Use the economic calendar for scheduled-event context and the risk/reward calculator for arithmetic. Neither establishes that the zone will hold.
Historical example: observations above a fixed boundary.
This dated example uses ECB euro foreign exchange reference rates. Freeze the maximum of the ten preceding published observations, then inspect the next five after a rate first exceeds that frozen level. The chart shows ten observations before and ten after the selected date for context.
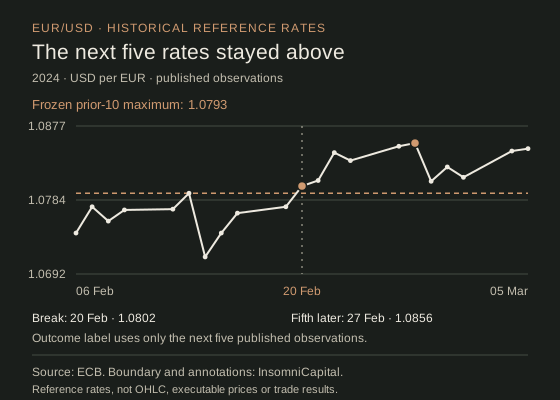
On 20 Feb 2024, the published reference rate of 1.0802 exceeded 1.0793, the highest of the preceding ten observations. All five following observations remained above that fixed level. The fifth, 27 Feb 2024, was 1.0856. That is the complete meaning of “follow-through” in this example; it does not establish that a trade could have entered or earned a profit.
On a small screen, scroll the table horizontally to read every column.
| Observation | Date or reference window | Reference rate | Position versus fixed boundary |
|---|---|---|---|
| Frozen prior-10 maximum | 06 Feb 2024–19 Feb 2024; maximum on 13 Feb 2024 | 1.0793 | Known before the selected observation |
| Selected break | 20 Feb 2024 | 1.0802 | Above the frozen boundary |
| Following observation 1 | 21 Feb 2024 | 1.0809 | Above the boundary |
| Following observation 2 | 22 Feb 2024 | 1.0844 | Above the boundary |
| Following observation 3 | 23 Feb 2024 | 1.0834 | Above the boundary |
| Following observation 4 | 26 Feb 2024 | 1.0852 | Above the boundary |
| Following observation 5 | 27 Feb 2024 | 1.0856 | Above the boundary |
These are daily reference observations, not OHLC candles or executable bid/ask quotes. They cannot show an intraday retest, stop touch, spread or actual fill. The two dates were selected retrospectively to illustrate contrasting outcomes; they do not estimate reliability or profitability.
Data, method and what was knowable at the time
The ten earlier published values determine the boundary before the selected observation. The later five values determine the outcome label only afterwards. Keep that distinction when reviewing a chart: the outcome was not known at the break.
The ECB normally determines its reference rates through a procedure around 14:10 CET and usually publishes them around 16:00 CET on working days, excluding TARGET closing days. These dates are reference-observation dates, not midnight UTC candle-close timestamps. We retain the published rates, leave non-publication gaps unfilled and use calendar dates along the chart.
Download all 256 published 2024 reference observations (CSV) or download the selection method and source metadata (JSON). The underlying data are freely available from the ECB data service. Reproduction follows the ECB reuse conditions; the ECB supplies the rates, while InsomniCapital supplies the calculations and interpretation.
Compare the April reference-rate example that returned below its boundary. Neither selection proves that a broker order would fill.
Work through it yourself.
Compare pattern boundaries, completion rules and failures alongside the full guide.
Download chart-pattern reference PDF · 2 pagesFree to download without registering. Practice examples explain the method; they do not establish a profitable strategy.
Common support-and-resistance questions.
Should I draw zones using wicks or candle bodies?
Either can define a reproducible method. Write down the convention, timeframe and tolerance first, then evaluate it consistently. Switching after an outcome introduces hindsight.
Does every resistance break become support?
No. Role reversal is a possible sequence. Price may never return, may cut straight back through, or may trade around the area without a useful directional move.
Do more touches make a level stronger?
Touch count alone cannot establish strength. Define independent visits, elapsed time and the entry rule, then measure outcomes instead of assuming a universal relationship.
Sources & assumptions.
Prepared by InsomniCapital; see our editorial approach. Sources checked on 2 October 2026. Schematics and hypothetical calculations are labelled educational illustrations. Historical observations identify their source, dates and method separately. Neither is a live quote, trade recommendation or reported trading result.
- Fidelity: support, resistance and role reversal.
- CME Group: chart types and OHLC data.
- Investor.gov: order execution risks (securities examples).
- European Central Bank: historical USD per EUR reference rates.
Educational information only, not personalised investment advice. Leveraged trading carries a high risk of loss. Read our risk disclosure. InsomniCapital has an Axi affiliate relationship and may receive compensation for qualifying referrals. References are not endorsements of this guide.