Trading education · Chart patterns
Chart Patterns: Identification, Breakouts and Failures
Understand double tops and bottoms, head and shoulders, triangles and flags. Compare confirmation, invalidation and failed breakout examples.
Explore the guide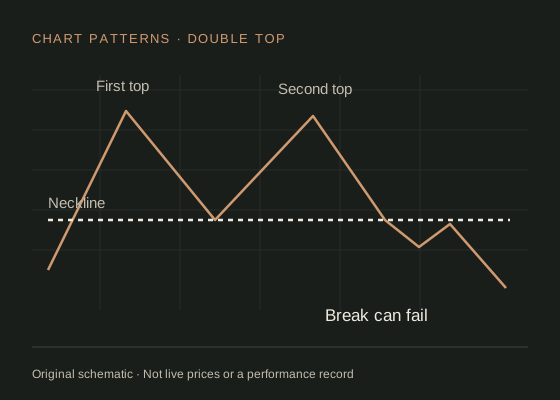
The short answer
Chart patterns describe a sequence of price swings. A recognisable outline is only a candidate: the boundary, completion rule and failure condition must be defined before the outcome is known. Measured targets are projections, not forecasts.
Start with the swings and the boundary.
A chart pattern spans multiple swings, while a candlestick pattern often focuses on a handful of individual candles. Start with the price-action overview if higher highs, lower lows and swing points are unfamiliar. Patterns inherit the chart's timeframe and feed: a tidy one-minute formation may be a minor fluctuation on an hourly chart.
Record where the candidate begins, which completed swings define it, and the price boundary that would complete it. A peak confirmed using later candles was not known at its eventual plotted timestamp. In a backtest, wait until the confirming information exists before allowing an entry.
Charles Schwab: double tops and bear flags and Charles Schwab: head-and-shoulders identification and limitations describe common reversal and continuation formations. Our examples below use deliberately simple paths so that completion and failure are easy to distinguish.
Compare the main pattern families.
| Pattern | Candidate structure | Completion and possible failure |
|---|---|---|
| Double top / bottom | Two similar highs / lows with a meaningful swing between them. | A move beyond the intervening trough / peak completes the common interpretation. A return inside can invalidate the breakout hypothesis. |
| Head and shoulders | Three peaks, with the middle higher; inverse version uses lows. | The neckline joins the intervening swings. A neckline break can fail and recover above it. |
| Ascending / descending triangle | One approximately flat boundary and a converging sequence of lows / highs. | Wait for your specified boundary break; the label does not force the direction. |
| Symmetrical triangle | Lower highs and higher lows compressing the range. | Either side can break. A late, weak move near the apex may give little room for execution. |
| Bull / bear flag | An impulse followed by a smaller counter-direction consolidation. | Continuation is a hypothesis after the flag boundary breaks. A deeper reversal can destroy the setup. |
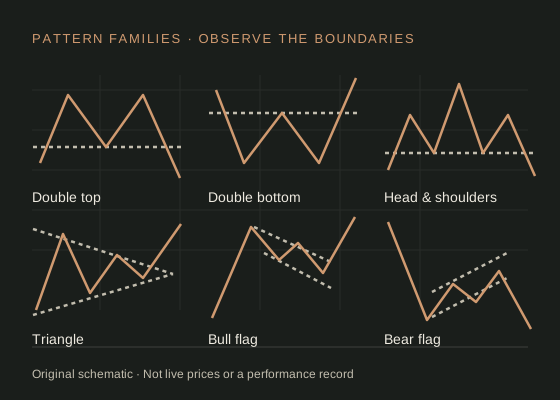
Similarity does not mean exact equality. If your double-top rule allows a five-pip difference between peaks, write that tolerance down beforehand. Also define how far apart swings must be; otherwise almost any noisy chart can be made to fit a label.
Work through a double top without hindsight.
Imagine EUR/USD peaks near 1.1100 twice, with an intervening low of 1.1060. Before a downside break, it is a candidate double top. Under a close-based rule, a wick below 1.1060 followed by a close above it is not the same event as a completed close below it.
The pattern height is 40 pips. Subtracting that from a 1.1060 neckline projects 1.1020. This geometric projection is not a promised destination. Suppose a later short entry were modelled at 1.1055 with a stop at 1.1080: the distance to the projected target would be 35 pips against 25 pips of risk, or 1.4:1 gross. A visually large pattern can therefore offer a modest entry-specific ratio.
For a failed example, price closes below the neckline, then recovers above 1.1060 and continues through the second peak. A trader cannot erase that sample simply because the final chart no longer looks like a textbook top. Record the original timestamped candidate, the execution assumption and the eventual result.
Head and shoulders: separate the candidate from completion.
Consider a hypothetical EUR/USD sequence after an advance: a left shoulder at 1.1080, a trough at 1.1040, a head at 1.1120, another trough at 1.1040 and a right shoulder at 1.1090. The two troughs define a flat neckline. The right shoulder is below the head; it need not match the left shoulder exactly.
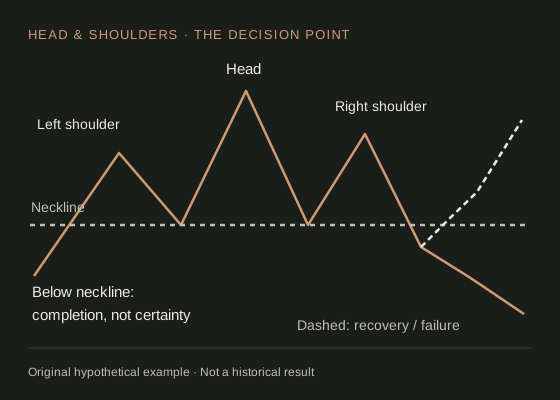
For this exercise, require a completed close below 1.1040 after the right shoulder. A wick through the neckline does not satisfy that rule. The 80-pip head-to-neckline height projects 1.0960, but an assumed short entry at 1.1035 with a stop at 1.1095 has 60 pips of risk and 75 pips to that projection: only 1.25:1 gross.
Distinguish two failures. Before completion, a rise above the head cancels this candidate under the example rule. After entry, a recovery through the stop is a losing trade even if the original neckline break was valid. A close back above the neckline can be a separate early-exit rule, but choose it before testing rather than adding it after a loss.
Real necklines can slope. Measure their price at the breakout time instead of copying an old trough price across the chart. Charles Schwab: head-and-shoulders identification and limitations explains the underlying convention; its stock-volume observations should not be treated as a global spot-forex volume feed.
Treat compression and continuation separately.
A triangle narrows the space between swing boundaries. A flag describes a consolidation after an impulse. They can overlap visually, but the reasoning differs: a triangle rule observes a range exit, while a flag rule also depends on an earlier directional move.
Ascending triangle: the direction is unresolved.
Imagine repeated EUR/USD highs near 1.1050 and successive lows of 1.1000, 1.1020 and 1.1030. Record the flat upper boundary and rising lower boundary as those swings become known. In this hypothetical rule, only a completed close above 1.1050 permits an upside-break candidate; a touch or wick is insufficient. A close below the rising boundary cancels that candidate. After an upside break, a return below 1.1050 is a possible failed breakout, not a reason to redraw the old boundary.
The widest initial span is 50 pips, so a simple upside projection is 1.1100. Entry at 1.1055 and stop at 1.1025 would leave 45 pips to that projection against 30 pips of risk, or 1.5:1 gross. The name “ascending” does not guarantee an upward exit or this target.
Bull flag: define the impulse and the expiry.
For a separate exercise, an impulse runs from 1.1000 to 1.1080. A smaller downward consolidation then forms upper-boundary swing points at 1.1070 and 1.1065 and lower-boundary points at 1.1045 and 1.1040. These describe a descending channel, not a horizontal range.
Allow no more than eight completed consolidation bars, cancel if price reaches 1.1030 before the breakout, and require a completed close above the declining upper boundary. Evaluate that boundary at the current bar; 1.1065 was the last swing price, not a permanent trigger. A late break after expiry is no trade under this example. A valid break can still reverse through a predeclared stop below the flag: record that loss without widening the channel. The numbers are illustrative research rules, not validated settings.
Spot forex usually lacks one centralised volume series covering the whole market. A rise in one broker's tick activity is a feed-specific observation. Do not apply exchange-volume claims to it without checking what the data represents.
Account for the trades a clean diagram omits.
A breakout can reverse immediately, retest several times, or gap past an intended entry. A stop order prioritises execution after triggering but does not guarantee the trigger price; a limit order can remain unfilled. The breakout example separates these decisions.
- Keep unsuccessful and ambiguous formations in the review set.
- Include spread, commission, slippage and overnight financing when applicable.
- Set one reproducible completion rule rather than switching between wicks and closes.
- Compare the proposed target with intervening zones, not just pattern height.
- Record skipped trades and the reason for skipping them.
Measured moves and pattern names do not produce an expectancy estimate. That requires a sufficiently broad set of timestamped observations and a consistent execution model.
Historical example: a break that did not hold.
This dated example uses ECB euro foreign exchange reference rates. Freeze the maximum of the ten preceding published observations, then inspect the next five after a rate first exceeds that frozen level. The chart shows ten observations before and ten after the selected date for context.
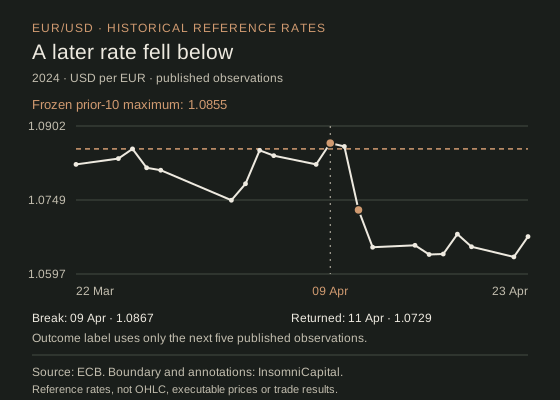
On 09 Apr 2024, the published reference rate of 1.0867 exceeded the prior-ten maximum of 1.0855. It remained above on 10 Apr 2024, then fell to 1.0729 on 11 Apr 2024. That return below the frozen boundary is the stated failure condition. Moving the boundary afterwards would change the observation rule.
On a small screen, scroll the table horizontally to read every column.
| Observation | Date or reference window | Reference rate | Position versus fixed boundary |
|---|---|---|---|
| Frozen prior-10 maximum | 22 Mar 2024–08 Apr 2024; maximum on 26 Mar 2024 | 1.0855 | Known before the selected observation |
| Selected break | 09 Apr 2024 | 1.0867 | Above the frozen boundary |
| Following observation 1 | 10 Apr 2024 | 1.0860 | Above the boundary |
| Following observation 2 | 11 Apr 2024 | 1.0729 | At or below the boundary |
| Following observation 3 | 12 Apr 2024 | 1.0652 | At or below the boundary |
| Following observation 4 | 15 Apr 2024 | 1.0656 | At or below the boundary |
| Following observation 5 | 16 Apr 2024 | 1.0637 | At or below the boundary |
These are daily reference observations, not OHLC candles or executable bid/ask quotes. They cannot show an intraday retest, stop touch, spread or actual fill. The two dates were selected retrospectively to illustrate contrasting outcomes; they do not estimate reliability or profitability.
Data, method and what was knowable at the time
The ten earlier published values determine the boundary before the selected observation. The later five values determine the outcome label only afterwards. Keep that distinction when reviewing a chart: the outcome was not known at the break.
The ECB normally determines its reference rates through a procedure around 14:10 CET and usually publishes them around 16:00 CET on working days, excluding TARGET closing days. These dates are reference-observation dates, not midnight UTC candle-close timestamps. We retain the published rates, leave non-publication gaps unfilled and use calendar dates along the chart.
Download all 256 published 2024 reference observations (CSV) or download the selection method and source metadata (JSON). The underlying data are freely available from the ECB data service. Reproduction follows the ECB reuse conditions; the ECB supplies the rates, while InsomniCapital supplies the calculations and interpretation.
Compare the February reference-rate example that stayed above its boundary. The contrasting selections illustrate the rule, rather than its success rate.
Work through it yourself.
Compare pattern boundaries, completion rules and failures alongside the full guide.
Download chart-pattern reference PDF · 2 pagesFree to download without registering. Practice examples explain the method; they do not establish a profitable strategy.
Common chart-pattern questions.
Does a double top require exactly equal highs?
No universal tolerance exists. Similar highs are the visual convention; a reproducible study needs an explicit price or volatility-based tolerance set in advance.
Does an ascending triangle always break upwards?
No. Its geometry describes the observations leading into the decision point, not the outcome. A downside break or repeated false breaks can occur.
How is a failed pattern different from an invalid candidate?
A candidate can fail your initial recognition rules before an entry exists. A completed pattern can also produce a losing trade. Preserve both distinctions in your journal.
Sources & assumptions.
Prepared by InsomniCapital; see our editorial approach. Sources checked on 2 October 2026. Schematics and hypothetical calculations are labelled educational illustrations. Historical observations identify their source, dates and method separately. Neither is a live quote, trade recommendation or reported trading result.
- Charles Schwab: double tops and bear flags.
- Charles Schwab: head-and-shoulders identification and limitations.
- Fidelity: support, resistance and role reversal.
- CME Group: chart types and OHLC data.
- European Central Bank: historical USD per EUR reference rates.
Educational information only, not personalised investment advice. Leveraged trading carries a high risk of loss. Read our risk disclosure. InsomniCapital has an Axi affiliate relationship and may receive compensation for qualifying referrals. References are not endorsements of this guide.