Trading education · Candlestick patterns
Candlestick Patterns: Visual Guide and Free PDF
Learn doji, hammer, engulfing and star candlestick patterns with original diagrams, failure examples and a free printable PDF reference sheet.
Explore the guide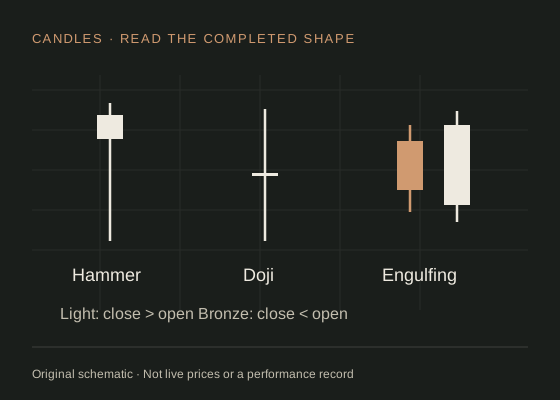
The short answer
A candlestick pattern describes the relationship between opening, high, low and closing prices. It can organise an observation; it does not establish a profitable trade. Read the completed pattern alongside its location, the wider trend and execution costs.
Read the candle before naming the pattern.
Each ordinary candle summarises one chosen interval. Its body runs between the open and close; the full wick spans the high and low. A rising candle closes above its open, while a falling candle closes below it. Changing from a five-minute chart to an hourly chart changes the observations you are grouping together. CME Group: chart types and OHLC data explains those underlying chart conventions.
Our diagrams use a light body for a rising candle and bronze for a falling candle. Colours are a display choice. Read the price scale and legend on your own platform, and distinguish ordinary OHLC candles from transformed charts such as Heikin-Ashi.
An unfinished candle can change shape before the interval closes. A long lower wick at 10:04 can disappear into a large falling body by the end of a five-minute bar. Record the completed interval and the chart's time zone before comparing examples.
Six patterns, with context.
The table condenses common naming conventions described by IG: candlestick anatomy and pattern conventions. “Bullish” and “bearish” describe the usual interpretation, not a measured probability. Body-size and wick thresholds vary between chart scanners.
| Pattern | Shape to recognise | Context and limitation |
|---|---|---|
| Doji | Open and close are equal or very close. | Small net movement; direction remains unresolved. |
| Hammer | Small body near the high; a long lower wick. | Usually discussed after a decline. The same shape after a rise is called a hanging man. |
| Shooting star | Small body near the low; a long upper wick. | Usually discussed after a rise. A similar shape after a decline is an inverted hammer. |
| Bullish engulfing | A rising body covers the preceding falling body. | Body engulfing does not require both wicks to be engulfed. |
| Bearish engulfing | A falling body covers the preceding rising body. | A larger opposite body alone does not establish a reversal. |
| Morning / evening star | Large body, small middle body, then an opposite body. | Gap-based textbook definitions need care in near-continuous forex markets. |
For repeatable study, write your own threshold before reviewing results. For example, call a candle a doji only when its body is no more than 10% of its high-to-low range, excluding a zero-range candle. That is an illustrative labelling rule, not a universal standard or a tested edge.
Hammer or inverted hammer? Check the wick.
These two hypothetical EUR/USD candles share a 22-pip range and a two-pip rising body. The body sits at opposite ends of the range. One pip is 0.0001 in this example.
| Candle | Open | High | Low | Close |
|---|---|---|---|---|
| Hammer shape | 1.1008 | 1.1012 | 1.0990 | 1.1010 |
| Inverted-hammer shape | 1.0992 | 1.1012 | 1.0990 | 1.0994 |
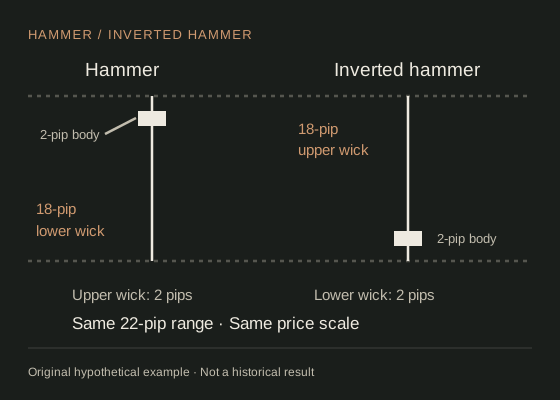
Calculate body size as |close − open|, upper wick as high − max(open, close), and lower wick as min(open, close) − low. The hammer has 18 pips below its body and two above; the inverted hammer has two below and 18 above.
The preceding movement determines the conventional name. After a decline, the first shape is discussed as a hammer and the second as an inverted hammer. After a rise, comparable shapes are called a hanging man and shooting star. Neither name demonstrates that the next candle will reverse: define the context and any follow-through requirement separately.
A hammer example, including a failure.
Use the hammer from the comparison: open 1.1008, high 1.1012, low 1.0990 and close 1.1010. Its body is 2 pips, lower wick 18 pips and upper wick 2 pips. Whether it follows a decline near a previously marked support area is a separate question.
For a hypothetical follow-through study, suppose the next completed candle closes above 1.1012. A model entry at 1.1014 and stop at 1.0988 create a 26-pip distance. An assumed target at 1.1066 is 52 pips away: 2:1 gross reward to risk. None of those prices is a live level, and an actual fill may differ.
The failure case matters just as much: the next candle can fall straight through 1.0990, or an initial rise can reverse after entry. The attractive shape remains in the historical chart even though the later trade lost. Keep failed examples in the same log as successful ones; selecting only clean reversals cannot estimate reliability.
Use the position-size calculator to translate a chosen cash budget into size, and allow for spread and commission before interpreting the 2:1 figure.
An engulfing example with two possible outcomes.
Suppose these completed candles appear after a decline into a zone already marked in your notes. Candle B's body spans 1.1000–1.1012 and contains candle A's 1.1002–1.1010 body. B is therefore a bullish engulfing candle under our body-based convention. Its high remains below A's high: it is not an outside bar.
| Candle | Open | High | Low | Close |
|---|---|---|---|---|
| A: falling | 1.1010 | 1.1016 | 1.1001 | 1.1002 |
| B: rising | 1.1000 | 1.1015 | 1.0998 | 1.1012 |
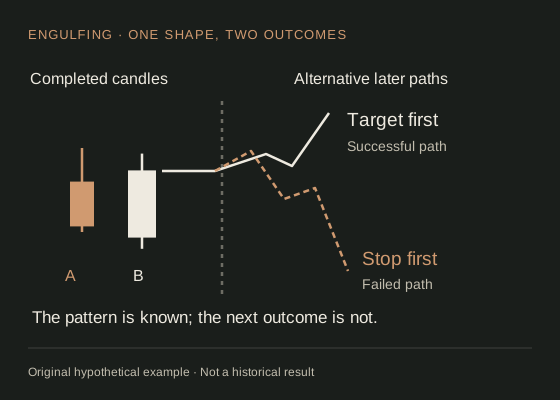
For this original study exercise, record the candidate only when B closes. Assume an executable entry of 1.1016 at the next interval, a stop at 1.0996 and a target at 1.1056. That is 20 pips of planned risk and 40 pips of potential reward before additional costs. The entry is a model assumption, not an automatic fill at the signal close.
- Successful path: the target is reached before the stop. The planned 40-pip gain depends on the fill and cost assumptions.
- Failed path: price first rises briefly, then reaches the stop before the target. B still satisfied the original engulfing definition, but the trade lost.
- Unresolved sequence: if a later candle's high and low cross both exits, OHLC data alone cannot show which came first. Use finer data or a declared conservative rule; do not award a win by assumption.
These paired scenarios demonstrate outcome uncertainty, not a win rate. A bearish engulfing exercise reverses the body directions and relevant price conditions; it still needs its own completed sample and execution rules.
Build a repeatable observation checklist.
- Location: mark the relevant zone before the candle forms, rather than adding it afterwards.
- Trend: distinguish a pullback within a trend from a proposed trend reversal.
- Completion: specify whether your rule requires a close beyond the pattern, a retest, or another observation.
- Invalidation: write down the price or time condition that ends the hypothesis.
- Execution: record bid/ask assumptions, spread, order type and upcoming news.
A wick shows that price visited and left an area within the interval. It does not reveal every trade in sequence or prove who traded there. On OTC forex feeds, broker tick volume also should not be described as total global market volume.
Compare a fixed rule across a held-out sample and different market conditions before making any performance claim. More confirmation can mean a later entry and a larger stop distance; it does not remove uncertainty.
Download the original reference sheet.
The two-page reference contains the same candle conventions, six illustrated pattern families and a practical review checklist. It is free to download without registering.
Download candlestick reference PDF · 2 pagesUse the sheet alongside this guide. The drawings are hypothetical, and the reference does not rank patterns by profitability.
Common candlestick questions.
Which candlestick pattern is most reliable?
There is no universal ranking here. Reliability requires a defined entry, exit, market, timeframe, cost model and independent sample. A shape alone does not supply those conditions.
Does engulfing mean the whole candle must be covered?
In the body-based convention used here, the second real body covers the first real body. An outside bar instead compares the full high-to-low ranges. Label which convention you use.
Can I use the same patterns for gold?
The OHLC descriptions transfer, but contract size, costs and volatility do not. Read the gold trading introduction before reusing a forex risk assumption.
Sources & assumptions.
Prepared by InsomniCapital; see our editorial approach. Sources checked on 2 October 2026. Schematics and hypothetical calculations are labelled educational illustrations. Historical observations identify their source, dates and method separately. Neither is a live quote, trade recommendation or reported trading result.
- IG: candlestick anatomy and pattern conventions.
- CME Group: chart types and OHLC data.
- Investor.gov: order execution risks (securities examples).
Educational information only, not personalised investment advice. Leveraged trading carries a high risk of loss. Read our risk disclosure. InsomniCapital has an Axi affiliate relationship and may receive compensation for qualifying referrals. References are not endorsements of this guide.