Trading education · Trading strategies
Breakout Trading Strategy: Rules, Costs and False Breaks
Study a fully specified forex range-breakout example, including candle-close confirmation, executable prices, expiry, sizing assumptions and failure cases.
Explore the guide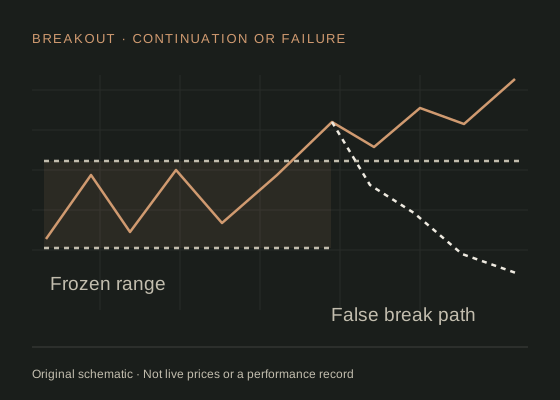
The short answer
A breakout method tests whether price continues beyond a previously defined boundary. Define the range before the signal, the observation that completes the break, and the price actually available afterwards. A wick through a line and a completed close beyond it are different events.
Define the question first.
This is an original, unvalidated study specification. Its numerical settings are teaching choices, not optimised parameters, personalised advice or evidence of profitability. All prices below are hypothetical.
This example asks whether EUR/USD continues upwards after leaving a one-hour reference range. It deliberately specifies one direction and one opportunity per day so that the mechanics can be inspected. A short-side variant would be a separate, explicitly written specification.
The boundary idea relates to support and resistance, but the example does not assume that every range break works. A range may expand briefly and then recover, producing a false breakout.
An explicit example rule set.
| Component | Teaching rule |
|---|---|
| Data and range | Use completed five-minute bid OHLC candles. Record the high and low from 08:00 inclusive to 09:00 exclusive, UTC. Freeze both at 09:00. |
| Signal window | From 09:00 to before 11:00 UTC, take only the first completed five-minute close strictly above the frozen high. |
| Entry | Model a market buy at the first available ask quote after that close. Skip if spread exceeds 2 pips or ask exceeds the range high by more than 5 pips. |
| Stop and target | Stop trigger: range low minus 2 pips on bid. Target: entry ask plus twice the entry-to-stop price distance, evaluated on bid. |
| Time and frequency | One entry at most per UTC date; no re-entry after a loss. Close any remaining position at the first available bid at or after 12:00 UTC. |
| News and data filter | Skip an entry within 15 minutes before or after a pre-scheduled high-impact EUR or USD event in the chosen calendar. Skip if quotes or the saved calendar are unavailable. |
The filters expire an opportunity; they do not postpone it into a later, better-looking signal. An entry skipped after the first qualifying close means no trade that day under this specification. The calendar provider and its event classification must be fixed in the study.
Work through entry, risk and costs.
Assume the frozen bid range is 1.1000–1.1020, a qualifying close occurs, and the next available ask is 1.1022 with a 1-pip spread. The stop trigger is 1.0998. The entry-to-stop distance is 24 pips, making the model target 1.1070, 48 pips above entry.
At a hypothetical 0.10 lot with 100,000 EUR units per lot, pip value is USD 1. The model price loss is USD 24 and price gain USD 48. Add USD 0.70 round-trip commission: a stop filled exactly at the trigger loses USD 24.70, while a target filled at its level gains USD 47.30. The net reward/loss ratio is approximately 1.915:1.
The ask-entry and bid-exit prices already express the spread. Subtracting another full spread would double count it. Slippage, financing if applicable and conversion charges would be additional assumptions. The position-size calculator can examine another chosen cash budget, subject to contract limits.
Keep the failure examples.
In one failure, the market closes above 1.1020 and quickly returns below the range high. In another, the next ask is already 1.1030, so the entry is skipped under the five-pip chase limit even if price later reaches the target. That later move cannot turn a skipped entry into a winner.
A news-driven gap could fill the stop below 1.0998. A limit target may not fill just because one indicative chart price touched it. Use the provider's executable quote and order rules; Investor.gov: order execution risks (securities examples) explains why execution and a displayed level are different concepts.
Also record days without any signal. Reporting only the subset with dramatic breakouts hides how frequently the process actually produces an opportunity.
What a credible test would need.
Use quote data granular enough to order the signal, entry, stop and target events. A five-minute candle that crosses both exit levels is ambiguous; resolve it with finer data or a stated conservative rule. Do not assume the favourable exit occurred first.
Keep the UTC window stable for this particular specification. It intentionally does not track London local time through daylight saving; a London-time window would be another variant. Compare costs across sessions using the session guide.
Freeze the choices before testing a separate period. Report skipped entries, spread distributions, fill assumptions and drawdown. A correct implementation of these rules would still not establish that the method is profitable.
Work through it yourself.
Record the plan, execution assumptions, outcome and lessons from a practice trade.
Download trading-review worksheet PDF · 2 pagesFree to download without registering. Practice examples explain the method; they do not establish a profitable strategy.
Common breakout questions.
Should I enter on a wick or a close?
They are different rules. This example waits for a completed close; a wick-triggered version needs its own execution and failure analysis.
Does a retest make a breakout safe?
No. Requiring a retest changes entry timing and can miss moves that never return. A retest can also fail.
Are the UTC times recommended trading hours?
No. They make the exercise reproducible. They have not been selected or validated for profitability.
Sources & assumptions.
Prepared by InsomniCapital; see our editorial approach. Sources checked on 2 October 2026. Schematics and hypothetical calculations are labelled educational illustrations. Historical observations identify their source, dates and method separately. Neither is a live quote, trade recommendation or reported trading result.
- Fidelity: support, resistance and role reversal.
- Investor.gov: order execution risks (securities examples).
- CME Group: chart types and OHLC data.
Educational information only, not personalised investment advice. Leveraged trading carries a high risk of loss. Read our risk disclosure. InsomniCapital has an Axi affiliate relationship and may receive compensation for qualifying referrals. References are not endorsements of this guide.