Rolling FX research
Forex Correlation Changes: A Rolling 2024 Study
Original rolling-window analysis of EUR/USD and GBP/USD reference returns: compare 20 and 60 returns, inspect changing estimates and download reproducible results.
Rolling FX research · Published
Across 236 overlapping twenty-return windows in the frozen 2024 ECB sample, EUR/USD and GBP/USD correlation ranged from 0.3726 to 0.9516. The window matters: a full-year estimate does not describe every shorter interval. This is historical description, not a hedge recommendation.
Original analysis by InsomniCapital. The observation period or hypothetical assumptions below determine what this study can establish; its publication date does not make the inputs live.
A single correlation number hides a changing sample.
The lowest twenty-return estimate is 0.3726, covering 30 July to 27 August 2024. The highest is 0.9516, covering 18 March to 17 April. All 236 twenty-return estimates are positive, but 22 are below 0.50. These are counts of overlapping windows, not independent trading opportunities or separate market regimes. The full-year study reports 0.7637 across 255 returns; neither result replaces the other because the included observations differ.
| Returns per window | Overlapping windows | Minimum (end date) | Maximum (end date) | Windows below 0.50 |
|---|---|---|---|---|
| 20 | 236 | 0.3726 (2024-08-27) | 0.9516 (2024-04-17) | 22 |
| 60 | 196 | 0.5704 (2024-10-21) | 0.9101 (2024-04-17) | 0 |
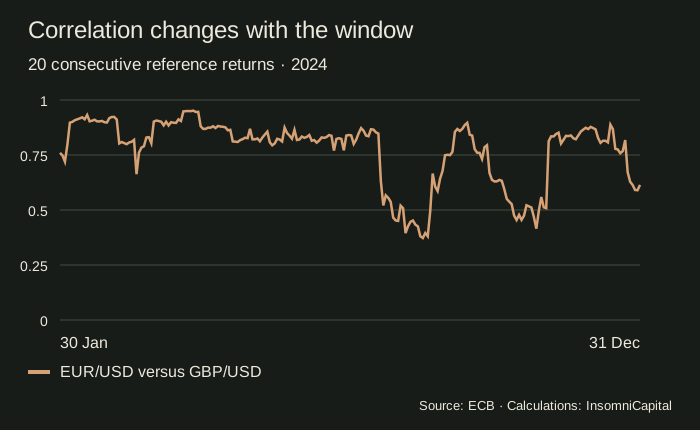
How sensitive is the estimate to its lookback?
The question is deliberately narrow: what correlation would be calculated from the latest twenty or sixty consecutive reference returns available on each eligible date in this dataset? We selected these two round lookbacks before calculating the summaries. Twenty and sixty intervals are convenient teaching horizons, not proven optimal trading settings. They are sometimes described loosely as a month and a quarter, but reference-publication gaps mean they are not fixed calendar periods.
A rolling estimate gains one return and loses another as the endpoint advances. A sudden change can therefore reflect the departure of an earlier observation as well as the arrival of a new one. The chart alone cannot attribute a movement to a policy decision, economic release or change in trader behaviour. Such a causal claim would require another study and appropriately timed information.
Use aligned returns and move one observation at a time.
Start with 256 ascending reference dates. EUR/USD is the USD-per-EUR source column. Derive GBP/USD by dividing USD per EUR by GBP per EUR on the same date. For each twenty-return window, take twenty-one prices and calculate ln(current rate ÷ previous rate) for both pairs. Subtract each series’ mean and divide the sum of paired deviations by the square root of the two sums of squared deviations. This is Pearson correlation of returns.
Advance the start and end by one source observation and repeat until the final date. There are 256 − 20 = 236 such windows. Repeat with sixty-one prices for each sixty-return window, producing 196 estimates. No return before the first selected price is imported. A constant return series would have undefined correlation; none of these samples is constant. Extrema are calculated from unrounded values and visible coefficients are rounded to four decimal places.
Association is not a probability or a hedge ratio.
A correlation of 0.95 does not mean two pairs rise together on 95% of dates. It measures a linear relationship between centred returns. Both rates share USD as their quote currency, and the derived GBP/USD return contains the same USD-per-EUR component used for EUR/USD. That shared component helps explain why the pairs should not automatically be treated as independent exposures; it does not establish an economically optimal hedge.
Longer windows average over more observations and can respond differently to recent changes. Smoother does not mean more accurate for every future decision, and a lower coefficient does not guarantee protection during an adverse move. An actual portfolio also depends on trade direction, quantity, contract value, account currency and financing. Our daily reference dashboard uses the same general return convention with a separately dated recent dataset; its current snapshot must not be substituted into this frozen study.
Reproduce the calculation from the source observations.
Download the frozen source CSV and this study’s result CSV and JSON. The input has 256 dates and three quotes per date: USD, GBP and JPY units per one EUR. The SHA-256 checksum is febf2b45b33628f8e8aceae6d28ced5833e78e4b393b13f14d5d316b8ee61bd8. The JSON records the publisher, original source query, retrieval timestamp, period, formulas and units. The result CSV preserves full floating-point output rather than the rounded numbers displayed in tables.
Open the source CSV in the historical forex lab. Select the two pairs and the exact first and last dates of a result row. The lab uses the same consecutive-observation convention. A twenty-return row must contain twenty-one reference dates; selecting twenty dates answers a different question. Compare the displayed rounded values, then inspect the downloads when greater precision is required. A later source revision must be reviewed and documented before replacing the frozen inputs.
What this sample cannot establish.
We use 2024 because it is the site’s existing reviewed full-year dataset, not because it was chosen from many years to support a trading claim. One year, three source currencies and derived crosses cannot represent every market regime. Adjacent rolling windows share most of their returns, so a count of windows is not a count of independent experiments. We report descriptive estimates without confidence intervals, causal claims or a statistical test of a permanent relationship.
The ECB publishes reference rates for information and discourages using them for transactions. They are neither a broker’s closing price nor intraday OHLC bars. A calendar gap remains a single observation interval; we do not insert weekends, holidays or interpolated values. The square-root-of-252 convention does not correct for unequal elapsed time, volatility clustering or serial dependence. These figures exclude execution costs and do not tell you the outcome of any position.
A small historical estimate does not establish safety. A large estimate does not identify the direction of the next move. Decisions about a demo exercise still need an explicit invalidation rule, contract units, combined exposure and an allowance for costs. Read the position-sizing-with-costs lesson before converting a hypothetical stop distance into quantity.
Publication and corrections
- — Initial publication.
No corrections recorded for this version. Substantive corrections should describe the changed claim, its effect on the findings and any replacement download. Read our research and corrections method.
Downloads and primary sources
- All 432 rolling correlation estimates (CSV)
- Results, source provenance and methods (JSON)
- Original rolling correlation chart (SVG)
The downloads contain the inputs, units or methods required to understand the results. Check the source period and assumptions before reusing them.
- European Central Bank: reference-rate purpose and publication convention
- ECB Data Portal: official 2024 USD, GBP and JPY source query
- European Central Bank: reuse and attribution terms
Source checks and arithmetic checks do not establish a profitable trading strategy. No independent professional review, live trading result or forecast is claimed. Read the risk disclosure.