Trading education · Economic releases
CPI Explained: Inflation, Core CPI and Market Expectations
Read US CPI releases correctly: headline versus core, monthly versus annual changes, actual versus forecast, base effects and seasonal revisions.
Explore the guide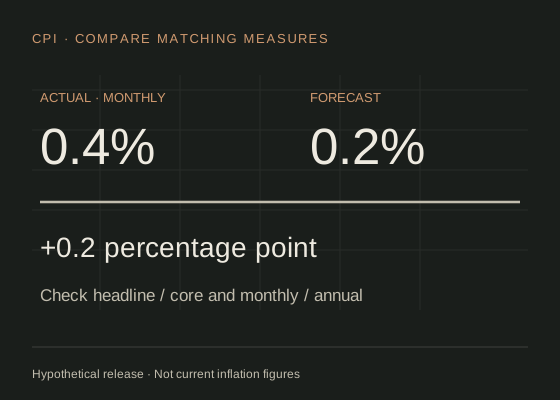
The short answer
The US Consumer Price Index measures changes in prices paid by urban consumers for a weighted basket. Separate headline from core, monthly from annual, and seasonally adjusted from unadjusted figures. A lower inflation rate can still mean prices are rising.
Headline, core and the price level.
The US CPI is produced by the Bureau of Labor Statistics. “Headline” usually refers to the all-items measure. The commonly discussed core measure excludes food and energy; those categories still matter to household spending, but excluding them provides another view of price changes. The BLS: CPI definitions, calculation and revisions explains the measures and their scope.
An index level and its rate of change answer different questions. If an index rises from 100 to 104, the price level is 4% higher. If it then rises more slowly, inflation has eased but prices have not necessarily fallen. A fall in the price level is different from a fall in the inflation rate.
The Federal Reserve's longer-run 2% inflation objective is expressed using the PCE price index, not CPI. CPI is relevant information, but it is not interchangeable with that target measure. See the Federal Reserve: the longer-run inflation objective and PCE.
Monthly and annual numbers can tell different stories.
A monthly percentage change compares an index with the preceding month. An annual change compares it with the same month a year earlier. US headline calendar rows commonly show a seasonally adjusted monthly figure and an unadjusted twelve-month figure. Always read the exact series label.
Percentage change = (new index ÷ comparison index − 1) × 100
For a hypothetical monthly series, an increase from 302.4 to 303.6 is approximately 0.397%, which rounds to 0.4%. For a separate illustrative annual comparison, 303.6 versus 294.6 is approximately 3.055%, or 3.1% to one decimal place. The denominator determines the question being answered; do not mix adjusted and unadjusted series.
Do not multiply a rounded monthly rate by twelve and call the result the published annual rate. Compounding, changing monthly observations and different adjustment conventions make that a different calculation.
Read actual versus forecast in matching units.
| Row | Forecast | Actual | Difference |
|---|---|---|---|
| Headline CPI, monthly | 0.2% | 0.4% | +0.2 percentage point |
| Core CPI, monthly | 0.3% | 0.3% | No difference at displayed precision |
| Headline CPI, annual | 3.0% | 3.1% | +0.1 percentage point |
The first row is higher than this forecast, while the core row matches at the displayed precision. Describing the entire report as simply “double expected inflation” exaggerates what one rounded monthly row establishes.
Consensus is provided by the calendar or survey source, not by the CPI index itself. Different providers can report different forecasts. Record the source and the pre-release timestamp if the comparison is part of a study.
A stronger-than-expected reading might change views about interest rates, but the market response also depends on details and prior expectations. It is not an automatic instruction to buy the dollar or sell gold.
Understand base effects and revisions.
Imagine this year's index is 104 against last year's 100: the annual change is 4%. One month later, the current index is 105 but the year-earlier comparison is 102. The annual rate is now approximately 2.94%, even though the current price level increased. The changing comparison base explains how annual inflation can slow while prices still rise.
Seasonally adjusted CPI history can be revised when seasonal factors are recalculated. BLS describes the annual process and possible revisions to the preceding five years in its BLS: seasonal adjustment and annual revisions. Do not transfer payroll-style revision assumptions to every CPI series.
Keep the exact series and publication vintage in a research log. “Previous 0.3%” on a calendar may not match a value saved earlier if the series was revised. Read the official release notes before interpreting that difference as a new current-month surprise.
Prepare for a release without guessing direction.
Locate the event in the economic calendar, then verify its date and time with the BLS: official release schedule for 2026. CPI releases are generally scheduled for 08:30 US Eastern Time. The equivalent local time changes with daylight saving and the location from which you are viewing it.
- Record the exact rows you intend to follow, including adjustment and comparison period.
- Save the consensus available before publication.
- Write scenarios for a mixed report, not only a clean upside or downside surprise.
- Observe spread and available quotes separately from the chart's last price.
- Review the release text, composition and revisions after publication.
An observational journal is a valid learning exercise. If you later test a trading rule, use information available at the time and include the cost of entering after the release, rather than assuming a fill at the pre-release price.
Common CPI questions.
Does falling inflation mean prices are falling?
Not necessarily. A smaller positive rate means the price level is increasing more slowly. A negative price change is a separate condition.
Is core CPI the Federal Reserve’s 2% target?
No. The longer-run objective refers to the PCE price index. Core CPI is one useful inflation measure, with a different definition and coverage.
Can CPI be revised?
It depends on the series. Seasonally adjusted history can change during annual recalculation; other CPI series follow different rules, and error corrections are also possible.
Sources & assumptions.
Prepared by InsomniCapital; see our editorial approach. Sources checked on 2 October 2026. Schematics and hypothetical calculations are labelled educational illustrations. Historical observations identify their source, dates and method separately. Neither is a live quote, trade recommendation or reported trading result.
- BLS: CPI definitions, calculation and revisions.
- BLS: seasonal adjustment and annual revisions.
- Federal Reserve: the longer-run inflation objective and PCE.
- BLS: official release schedule for 2026.
Educational information only, not personalised investment advice. Leveraged trading carries a high risk of loss. Read our risk disclosure. InsomniCapital has an Axi affiliate relationship and may receive compensation for qualifying referrals. References are not endorsements of this guide.