Execution-cost sensitivity
Gold Trading Costs: A Position-Size Sensitivity Study
An original hypothetical gold-cost model showing how stop distance and quantity change net outcomes and break-even thresholds, with reproducible CSV, JSON and chart.
Execution-cost sensitivity · Published
Under stated hypothetical costs, sizing a gold position for USD 100 of gross stop risk produces net losses of USD 127, USD 112 or USD 107. This is an arithmetic sensitivity study, not a historical backtest, a broker fee comparison or evidence of profitable trading.
Original analysis by InsomniCapital. The observation period or hypothetical assumptions below determine what this study can establish; its publication date does not make the inputs live.
The same gross risk leaves different net outcomes.
Three positions have a USD 100 loss before costs at their assumed stop and a USD 200 gain before costs at their assumed target. Their stop distances differ: USD 2, USD 5 and USD 10 per troy ounce. After the same cost convention is applied, the break-even win fractions become 42.333333%, 37.333333% and 35.666667%, respectively. Without any costs, this two-outcome model breaks even at one third.
The narrower distance requires more ounces to maintain the gross cash risk. That raises the cash effect of every per-ounce charge. This result describes sizing arithmetic; it does not show that wider stops improve a trading strategy. Changing a stop can also change which trades reach the target, how long they remain open and how they execute.
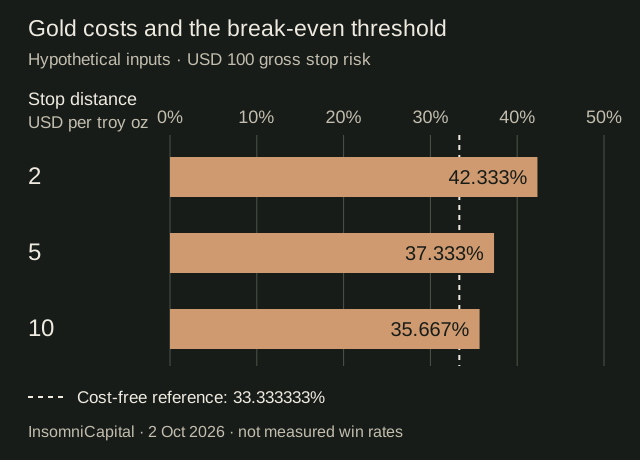
Define the cost boundary before calculating.
All quantities are troy ounces and all amounts are USD. Each scenario assumes an aggregate round-trip spread cost of USD 0.30 per ounce, an aggregate round-trip adverse slippage cost of USD 0.20 per ounce, and USD 2 commission for the complete trade. These are arbitrary teaching inputs, not current gold spreads, typical fees or Axi pricing. The same costs apply to both modelled outcomes.
The gross moves use idealised mid-price entry and exit references. The spread allowance represents the combined entry-and-exit difference from those references; it is charged once, not once per side again. Likewise, slippage and commission already cover both legs. If a trading record already uses actual bid/ask fills, adding these allowances to its realised result would double-count execution effects. Check which costs are already included before comparing records.
Methodology: preserve units through every step.
Let d be stop distance in USD per ounce, q quantity in ounces, and C total round-trip cost in USD. The main model sets q = 100 ÷ d, then places the target twice as far from the idealised entry. It evaluates only a full target outcome and a full stop outcome, with unchanged quantity. No dates, market levels, price paths or signals are sampled.
q = 100 ÷ d
C = q × (0.30 + 0.20) + 2
Net loss magnitude L = 100 + C
Net win W = 200 − C
Break-even win fraction p = L ÷ (L + W)
The last equation solves pW − (1 − p)L = 0. Here, L + W is always USD 300, because equal costs reduce the win and increase the loss by the same amount. The threshold is a required fraction within these assumptions, not an estimate of a strategy’s achievable win rate. Calculations retain full precision; displayed percentages round to six decimal places.
| Stop (USD/oz) | Quantity (troy oz) | Round-trip cost (USD) | Net loss magnitude (USD) | Net win (USD) | Break-even win fraction |
|---|---|---|---|---|---|
| 2 | 50 | 27 | 127 | 173 | 42.333333% |
| 5 | 20 | 12 | 112 | 188 | 37.333333% |
| 10 | 10 | 7 | 107 | 193 | 35.666667% |
Change a cost assumption and the threshold moves.
At the USD 2 stop, quantity is 50 ounces. An additional USD 0.10 round-trip cost per ounce therefore adds USD 5 to each trade’s costs. With the same gross outcomes, the break-even threshold rises by 5 ÷ 300, or 1.666667 percentage points. At the USD 10 stop, ten ounces incur only USD 1 of extra cost, moving the threshold by 0.333333 percentage points.
The downloadable sensitivity grid repeats all three stops at aggregate variable costs of USD 0, 0.25, 0.50 and 1 per ounce, retaining the USD 2 commission. Its zero-variable-cost row is therefore not cost-free. The separate chart reference removes both variable costs and commission. The grid changes assumptions systematically; none of its rows represents a measured trading session or an estimated cost distribution.
A total cash budget changes the quantity.
Holding gross stop risk at USD 100 is different from budgeting USD 100 including the assumed costs. For the latter, solve q × (d + 0.50) + 2 = 100. Thus q = 98 ÷ (d + 0.50), giving 39.2, 17.818182 and 9.333333 ounces for the three stops. Each unrounded quantity has a USD 100 modelled net loss; its smaller exposure also reduces the gross target gain.
These fractional quantities are algebraic outputs, not order instructions. Convert ounces into the instrument’s actual contract units and round down to a permitted increment before recalculating. CME’s gold products illustrate why units matter: its standard Gold and Micro Gold futures represent 100 and 10 troy ounces respectively. Those specifications do not define a broker’s gold CFD lot. See gold contract size and the gold position-size calculator.
What this study cannot establish.
There is no historical sample, observed win rate, confidence interval or tested strategy here. Stops and targets are hypothetical distances, not suggested market levels. Real outcomes can include partial exits, gaps, rejected orders and costs that differ between winners and losers. Execution policies distinguish favourable and adverse slippage; this illustration deliberately assumes a fixed adverse amount. Financing, conversion, taxes and changing liquidity are excluded.
Even the USD 100 all-in sizing result is conditional on these assumed fills and charges. It is not a guaranteed maximum loss. Actual contract increments, minimum commissions and margin requirements may prevent a calculated quantity from being usable. Before interpreting a threshold as viable, a separate study would need specified entry and exit rules, appropriate bid/ask data, realistic execution and independent validation. Read backtesting basics and position sizing with costs.
Reproduce or challenge the arithmetic.
The CSV contains twelve gross-risk sensitivity rows and three all-in-budget rows. Its column names identify units; break-even fractions are decimals, so multiply by 100 for percentages. The JSON preserves assumptions, formulas, source links and unrounded outputs. Neither file contains broker observations. Recalculate quantity, both net outcomes and the zero-expectation equation independently; rounding intermediate quantities changes the budget check.
Published 2 October 2026. Original model, calculations and chart by InsomniCapital. The primary references below support instrument units and execution-cost concepts only. They are not the source of the scenario’s numerical fees and do not endorse its conclusions.
Publication and corrections
- — Initial publication.
No corrections recorded for this version. Substantive corrections should describe the changed claim, its effect on the findings and any replacement download. Read our research and corrections method.
Downloads and primary sources
- Download all 15 scenario rows (CSV)
- Download assumptions and unrounded results (JSON)
- Open the original chart (SVG)
The downloads contain the inputs, units or methods required to understand the results. Check the source period and assumptions before reusing them.
- CME Group: Gold and Micro Gold contract units
- OANDA Europe: order execution policy, costs and slippage
- OANDA UK: financing and currency-conversion charges
Source checks and arithmetic checks do not establish a profitable trading strategy. No independent professional review, live trading result or forecast is claimed. Read the risk disclosure.