Trading education · Economic events
PMI Explained: Manufacturing, Services, Flash and Final Readings
Understand PMI diffusion indices, the 50 threshold, S&P Global versus ISM, flash and final releases, revisions and actual-versus-forecast comparisons.
The short answer
PMI surveys summarise how respondents say business conditions changed from the previous month. Identify the publisher, sector and exact index before interpreting the number. A reading above 50 is not a GDP growth percentage, and a forecast surprise is different from a change in the index.
Name the publisher and the exact measure.
PMI stands for Purchasing Managers’ Index. An economic calendar can contain several releases with similar names, including surveys from S&P Global and the Institute for Supply Management. They have different panels and construction methods. One provider’s result is not a revision of the other provider’s result.
Record country or region, survey month, publisher, sector, index name and release stage. Manufacturing headline, manufacturing output, services business activity and a composite output index are not interchangeable. Use the economic-events hub to organise the subject and the calendar to locate the release, then verify the publisher’s own page.
This identity check comes before describing a surprise. Comparing a services forecast with a manufacturing result produces an arithmetic difference with no useful like-for-like meaning.
Understand what the 50 threshold measures.
S&P Global: PMI diffusion methodology and flash estimates describes a diffusion calculation that gives full weight to the share reporting an increase, half weight to unchanged responses and zero to decreases. For an output question, the comparison concerns activity relative to the previous month.
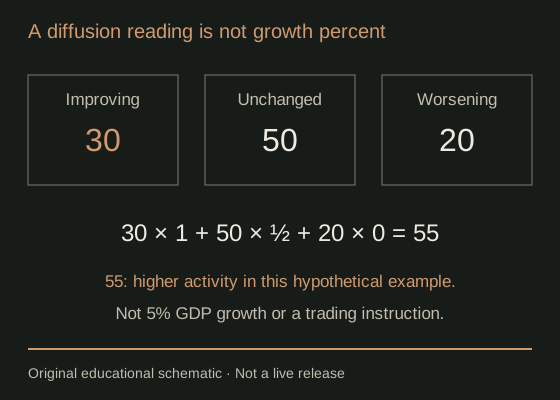
In a hypothetical activity question, 30% report higher activity, 50% no change and 20% lower activity. They sum to 100%. The unadjusted index is 30 + 0.5 × 50 + 0 × 20 = 55. This is a single-question teaching example, not a calculation of a published headline PMI from raw survey records.
A reading of 50 represents a balance consistent with no change; it does not require every respondent to be unchanged. If all responses were unchanged the result would also be 50. The index summarises the direction and breadth of responses, not the exact percentage change in national output.
Separate a headline from its components.
| Measure | Construction distinction | Interpretation check |
|---|---|---|
| S&P Global manufacturing headline | Combines five components with different weights. | It is broader than the manufacturing output question alone. |
| S&P Global services headline | The Services Business Activity Index measures activity. | Compare output concepts consistently across sectors. |
| S&P Global Composite Output Index | Combines manufacturing output and services activity with sector weights. | It is not a simple average of the two headline PMI numbers. |
| ISM Manufacturing PMI | Combines five equally weighted components. | Use ISM’s own component definitions and adjustments. |
| ISM Services PMI | Combines four equally weighted components. | It differs from a single services-activity question. |
S&P Global: headline PMI and component indices and S&P Global: interpreting the output and composite indices explain the S&P distinctions. ISM: diffusion formulas, headline construction and seasonal revisions sets out ISM’s calculations. An index called “composite” within a manufacturing report is not necessarily the cross-sector Composite Output Index.
Read the level and the monthly change separately.
For a hypothetical output diffusion index, a fall from 55 to 52 still leaves the reading above the no-change threshold. It indicates a weaker positive survey signal, not an automatic fall in the level of output. Moving from 48 to 49 improves the index while leaving it below 50.
A prices index needs its own question. A decline from 60 to 55 can still signal more firms reporting price increases than decreases. It does not mean prices fell 5%, and it is not a CPI inflation reading. Headline activity and price components can move in different directions.
Supplier delivery times need extra care. ISM’s slower-delivery responses raise its delivery index. S&P’s raw delivery-times index has the opposite orientation and is inverted when used in its manufacturing headline. S&P Global: supplier delivery times and index direction explains why delays can reflect supply constraints as well as demand; slower deliveries are not unambiguously good news.
Keep a forecast surprise distinct from momentum.
Consider a separate invented release: previous reading 52.0, forecast 50.4 and actual 51.2. The actual exceeds the forecast by 0.8 index points, but is 0.8 points below the previous reading. It remains above 50. Those three statements answer different questions.
Record the forecast source and when it was observed. A consensus figure is an expectation, not part of the publisher’s survey outcome. The previous value may have a different vintage, so preserve any separately identified revision.
Do not convert the 0.8-point surprise into a GDP growth estimate or a promised currency move. Market interpretation also depends on components, other releases and prior positioning; the subtraction alone does not identify those influences.
Track the release stage and historical vintage.
S&P’s flash PMI is an early estimate based on a substantial subset of responses, followed by the final release for the same survey month. A flash-to-final difference is an updated estimate of that month, not automatically a new month’s acceleration or slowdown. Confirm whether both numbers refer to the same series.
Separate that update from later historical changes. ISM’s annual seasonal-factor process can revise earlier adjusted readings. A spreadsheet downloaded today can therefore differ from the values available on the original release date. Do not silently use the later version in an announcement backtest.
Save the release link, publication date and the numerical vintage used in your notes. Full historical datasets and feeds can be licensed products. This guide supplies hypothetical calculations rather than reproducing a provider’s proprietary series; check the applicable access and reuse terms before redistributing data.
Build a short, auditable release note.
- Verify publisher, geography, month, sector and flash/final status.
- Copy the headline and relevant component names into separate fields.
- Compare actual with the documented forecast and matched previous value.
- Record revisions, collection-period caveats and the official publication link.
- Write an interpretation and at least one plausible competing explanation.
Connect policy interpretations to the actual central bank communication; a PMI result does not itself change an official interest rate. Compare employment components with the different coverage of the employment report, rather than expecting the two to match mechanically.
Common PMI questions.
Does a PMI of 55 mean GDP grew 5%?
No. It is an index reading, not a national-accounts growth rate. The survey question, component mix and coverage matter.
Is a result above forecast necessarily expansion?
No. A result can beat its forecast and still be below 50. The forecast comparison and no-change threshold are separate.
Can I assume a fixed release time every month?
No. Check the publisher’s current schedule and stated time zone; holidays and release types can affect the timetable.
Sources & assumptions.
Prepared by InsomniCapital; see our editorial approach. Sources checked on 2 October 2026. Schematics and hypothetical calculations are labelled educational illustrations. Historical observations identify their source, dates and method separately. Neither is a live quote, trade recommendation or reported trading result.
- S&P Global: PMI diffusion methodology and flash estimates.
- S&P Global: headline PMI and component indices.
- S&P Global: interpreting the output and composite indices.
- S&P Global: supplier delivery times and index direction.
- ISM: diffusion formulas, headline construction and seasonal revisions.
Educational information only, not personalised investment advice. Leveraged trading carries a high risk of loss. Read our risk disclosure. InsomniCapital has an Axi affiliate relationship and may receive compensation for qualifying referrals. References are not endorsements of this guide.