Trading education · Growth releases
GDP Explained: Real Growth, Annualised Rates and Revisions
Understand US GDP, real versus nominal output, quarterly annualised growth, components and revisions. Work through the arithmetic before comparing forecasts.
The short answer
Gross domestic product measures final production within an economy. US quarterly GDP headlines commonly report an annualised change in real output, which is different from a simple quarterly change, a year-on-year rate or nominal growth. The estimate’s components and publication vintage matter alongside the headline.
Measure domestic production, not every transaction.
GDP measures the value of final goods and services produced within an economy over a period. “Final” avoids repeatedly counting intermediate inputs in the same production chain. “Domestic” concerns where production takes place, rather than the nationality of the company’s shareholders.
BEA: what GDP measures and its estimate sequence distinguishes nominal, or current-dollar, GDP from real GDP, which adjusts for price changes. Nominal growth can reflect both more production and higher prices. Real growth aims to separate quantity change from inflation. Neither measure directly tells you whether every household’s living standard improved.
A US GDP calendar row needs its reference quarter, estimate version and rate convention. A percentage without those labels is incomplete. GDP is a broad accounting estimate, not a real-time quote or an individual company’s sales report.
Convert a quarterly change into an annualised rate.
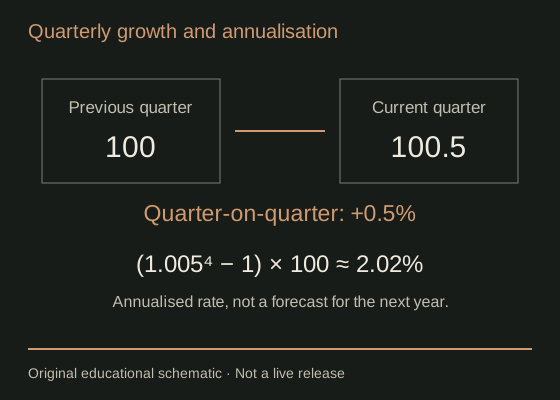
Assume a hypothetical real-output index rises from 100 in one quarter to 100.5 in the next. Both observations use the same definition and seasonal-adjustment basis. These are index points chosen for arithmetic, not actual US GDP levels.
| Measure | Calculation | Result |
|---|---|---|
| Quarter-on-quarter change | (100.5 ÷ 100 − 1) × 100 | 0.50% |
| Quarter-on-quarter annualised change | ((100.5 ÷ 100)^4 − 1) × 100 | 2.015050%, approximately 2.02% |
BEA: calculating quarterly and annualised growth rates explains the compound calculation. Annualising asks what the change would be if that quarterly pace repeated for four quarters. It is not a prediction that it will repeat, and it is not the observed growth between this quarter and the same quarter last year.
Multiplying 0.5% by four gives a rough 2% approximation, while compounding gives about 2.02%. Rounding explains part of the difference. Compare international releases only after aligning rate conventions; a 0.5% quarterly rate and a roughly 2% annualised rate can describe the same pace.
Keep the growth rate separate from its level.
GDP tables can display dollar levels, real quantity measures and percentage changes side by side. A seasonally adjusted annual-rate level expresses a quarter’s flow at an annual pace; it does not mean that the stated amount was produced during that quarter alone. The annualised percentage change between quarters is another calculation.
Read the table heading, units and footnotes before copying data. The BEA: GDP releases, tables and previously published estimates links to the official releases and tables. For an event comparison, establish whether “actual” and “forecast” both refer to real GDP growth rather than mixing nominal dollars with a real growth rate.
Price-adjusted GDP uses detailed methods, not one universal subtraction of CPI from nominal growth. The consumer price index measures a different basket. A familiar inflation percentage is not automatically the appropriate deflator for all domestic production.
Read how the components contributed.
The expenditure approach combines consumption, investment, government expenditure and exports, then subtracts imports. BEA: the expenditures approach to GDP explains why imports are subtracted: expenditure categories can already contain foreign-produced goods and services. Removing them isolates domestic production; it does not mean every import is economically harmful.
Changes in inventories or net exports can influence headline growth even when household spending tells a different story. Distinguish the level of inventory investment from a change in its contribution to growth. A falling stock of inventories is not the only way inventories can subtract from GDP growth.
Use the published contribution tables when asking which components added to or subtracted from the growth rate. BEA: GDP methods, revisions and chained-dollar limitations explains that chained-dollar component levels generally are not additive outside the reference period. Adding those displayed levels as though they were ordinary current-dollar amounts can produce a misleading reconciliation.
Treat advance, second and third estimates as vintages.
The advance estimate gives an early picture using incomplete information. Second and third estimates incorporate more information. Later annual or comprehensive updates can revise the history again; “third” does not mean permanently final.
Imagine a purely hypothetical real annualised advance estimate of 2.0% against one provider’s 1.8% consensus. The gap is 0.2 percentage point. Suppose the prior quarter’s estimate is simultaneously revised from 1.6% to 1.4%. Record that separately: it changes the historical comparison but is not another 0.2 point of current-quarter growth.
For research, preserve the publication date, quarter, estimate version, original table and forecast timestamp. Downloading today’s revised history and pairing it with the old release time can introduce information unavailable to traders then. When comparing second estimates, identify whether the forecast concerns the revised level or growth rate itself; do not assume every provider’s row means the same thing.
Separate a growth surprise from a trade instruction.
Growth news can influence expectations for earnings, interest rates and demand. A stronger number may support expectations of tighter monetary policy, but its composition and inflation context can change that interpretation. A revision to an old quarter can carry different information from an unexpectedly strong new estimate.
For currencies, relative expectations matter: US growth is only one part of a two-economy comparison. For gold, the interaction of yields, the dollar, risk conditions and positioning can outweigh a simple “strong growth” narrative. No GDP threshold supplies a universally correct buy or sell instruction.
Connect the release with employment data and the Federal Reserve’s policy communication. Record what prices did over a stated window without claiming that one report proves the cause of the entire move.
Audit one GDP calendar comparison.
- Find the release in the economic calendar and verify the publication with BEA.
- Label the country, reference quarter, real or nominal basis and estimate vintage.
- Write the rate convention beside both actual and provider forecast.
- Check components, price measures and prior-period revisions before interpreting the headline.
- Save the release and separate observed market movement from any proposed explanation.
The economic events centre connects GDP with other growth and inflation releases. Sources checked 2 October 2026. All numerical examples above are hypothetical.
Common GDP questions.
Does 2% annualised quarterly growth mean the economy grew 2% during that quarter?
No. Annualisation compounds the quarterly rate over four quarters. Identify the published convention before comparing or converting it.
Is the third GDP estimate the last revision?
No. Later updates can revise historical estimates when additional data or methods become available.
Does rising total GDP guarantee rising output per person?
No. Total GDP and GDP per person are different measures. Population growth can change their relationship.
Sources & assumptions.
Prepared by InsomniCapital; see our editorial approach. Sources checked on 2 October 2026. Schematics and hypothetical calculations are labelled educational illustrations. Historical observations identify their source, dates and method separately. Neither is a live quote, trade recommendation or reported trading result.
- BEA: what GDP measures and its estimate sequence.
- BEA: calculating quarterly and annualised growth rates.
- BEA: GDP methods, revisions and chained-dollar limitations.
- BEA: the expenditures approach to GDP.
- BEA: GDP releases, tables and previously published estimates.
Educational information only, not personalised investment advice. Leveraged trading carries a high risk of loss. Read our risk disclosure. InsomniCapital has an Axi affiliate relationship and may receive compensation for qualifying referrals. References are not endorsements of this guide.