Trading education · Inflation releases
PCE Inflation Explained: Headline, Core and the Fed
Read US PCE inflation correctly: headline versus core, monthly versus annual changes, CPI differences, revisions and the Federal Reserve’s inflation target.
The short answer
The PCE price index measures changing prices for goods and services bought by, or on behalf of, US consumers. It is distinct from the dollar amount they spend. Identify the exact price series, comparison period and data vintage before comparing a release with expectations or interpreting a market reaction.
Separate prices, spending and real consumption.
The monthly Personal Income and Outlays release contains several measures that can appear under a short “PCE” calendar label. Nominal personal consumption expenditures measure spending in dollars. The PCE price index measures prices. Real PCE adjusts spending for price changes to describe the quantity of consumption. A rise in spending does not, by itself, show how much prices or quantities increased.
BEA: Personal Consumption Expenditures price index identifies the price series; BEA: consumer spending, prices and real PCE explains the spending measures. Read the full row label before recording a number. A monthly change in real spending cannot be compared with a forecast for annual core inflation merely because both come from the same report.
Understand headline and core PCE.
Headline PCE includes the full covered basket. Core PCE excludes defined food and energy categories to help examine price movements without those components. Core is not the cost of living experienced by someone who no longer buys food or fuel, and it is not an assurance that the remaining prices are stable.
The classification has detail: BEA: the food and energy categories excluded from core PCE explains that its food exclusion covers food and beverages purchased for off-premises consumption; food services are classified separately. Do not infer exact coverage from the everyday meaning of “food”.
The Federal Reserve: the longer-run inflation objective specifies a longer-run 2% objective measured by the annual change in the overall PCE price index. Core provides additional information about underlying developments; it is not a separate 2% target replacing headline PCE. One monthly observation cannot establish whether the longer-run objective has been met.
Calculate monthly and annual inflation separately.
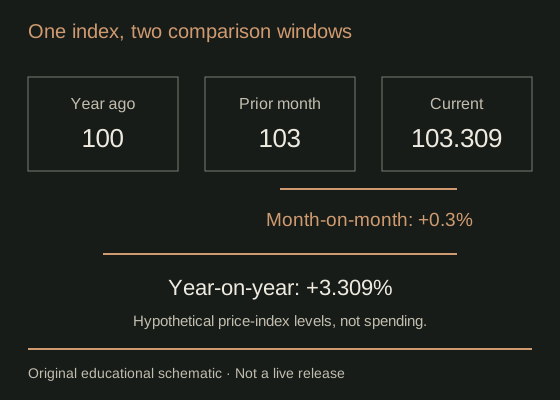
Use a hypothetical single price-index series with index level 100 twelve months before the current month, 103 in the previous month and 103.309 now. These are index points, not dollars or actual release observations. Keep the same adjustment convention throughout.
| Comparison | Calculation | Result |
|---|---|---|
| Month on month | (103.309 ÷ 103 − 1) × 100 | 0.30% |
| Year on year | (103.309 ÷ 100 − 1) × 100 | 3.309%, approximately 3.31% |
The monthly rate compares adjacent months. The annual rate compares the current month with the same month one year earlier. They can move in different directions as the comparison base changes. Neither equals the change in the currency or gold price.
A published percentage is rounded. Recalculating from rounded displayed index levels may differ slightly from an official rate calculated with greater precision. Do not multiply one monthly rate by twelve and relabel it an observed annual rate: that substitutes an assumption about other months for their data.
Know why PCE and CPI need not agree.
PCE and CPI answer related questions using different coverage, weights and index formulas. PCE includes expenditure made on consumers’ behalf, including some healthcare paid by others. The BEA: why PCE and CPI inflation differ describes these differences. Consequently, a CPI result cannot simply be copied into the later PCE calendar row.
The CPI guide covers that separate release. For a PCE event note, specify which CPI components, if any, informed an expectation and recognise that a forecast remains uncertain. A familiar inflation headline is context, not a substitute for the exact series being released.
Keep actual, consensus and revised history separate.
Consider a completely hypothetical headline monthly PCE reading of 0.3% against a calendar provider’s 0.2% forecast. The difference is 0.1 percentage point, or 10 basis points. That is a comparison between two inflation rates; it does not predict a ten-basis-point interest-rate change.
Suppose the previous month was originally reported as 0.2% and is now revised to 0.1%. Preserve both versions. The current surprise and the revision describe different information. A calendar’s consensus is a provider or survey estimate, not a forecast certified by BEA, and providers can disagree.
BEA: price measures, inflation and revisions explains why earlier price estimates can change. Record the release timestamp, reference month, exact series and original file. A current historical download may include information unavailable when the original announcement occurred. Using it as if it were the first-release data introduces hindsight into event research.
Treat currency and gold reactions as conditional.
A stronger inflation reading may influence expectations about the future policy path. Whether that supports the dollar or weighs on gold depends on what was already expected, the report’s details, changes in yields, competing news and positioning. A result above one survey median is not necessarily above the expectations priced into every market.
Record the observation separately from the explanation: “EUR/USD fell over this defined window” is an observation; “PCE caused the entire move” needs more evidence. Read FOMC decisions alongside employment releases rather than assuming inflation is the only input. Wider spreads or slippage can also make a chart move differ from an executable result.
Prepare a comparable release record.
- Find the event in the economic calendar, then verify its identity and schedule with BEA.
- Write headline or core, monthly or annual, the reference month and adjustment convention.
- Save the provider, timestamp and units of any forecast before publication.
- Record the actual, previous original and previous revised figures independently.
- Describe a fixed observation window and execution conditions without inferring a reliable trade direction.
Use the economic events centre to connect related releases. Sources checked 2 October 2026; this guide explains definitions and hypothetical calculations, not a current inflation forecast.
Common PCE inflation questions.
Is core PCE the Federal Reserve’s official inflation target?
The longer-run objective is defined using overall PCE inflation. Core PCE is an additional measure used to assess underlying price developments.
Does lower inflation mean prices have returned to their old level?
No. A slower positive rate still means prices increased over that comparison window. Falling prices require a negative change in the relevant index.
Is a higher-than-forecast PCE figure automatically a dollar-buying signal?
No. Expectations, revisions, components, other news and execution conditions can change the interpretation and observed response.
Sources & assumptions.
Prepared by InsomniCapital; see our editorial approach. Sources checked on 2 October 2026. Schematics and hypothetical calculations are labelled educational illustrations. Historical observations identify their source, dates and method separately. Neither is a live quote, trade recommendation or reported trading result.
- BEA: Personal Consumption Expenditures price index.
- BEA: the food and energy categories excluded from core PCE.
- BEA: why PCE and CPI inflation differ.
- BEA: price measures, inflation and revisions.
- BEA: consumer spending, prices and real PCE.
- Federal Reserve: the longer-run inflation objective.
Educational information only, not personalised investment advice. Leveraged trading carries a high risk of loss. Read our risk disclosure. InsomniCapital has an Axi affiliate relationship and may receive compensation for qualifying referrals. References are not endorsements of this guide.