Trading education · Growth releases
Retail Sales Explained: Spending, Inflation and Revisions
Read US retail sales with clear examples of nominal versus real growth, forecast surprises, exclusions, sampling uncertainty and revisions.
The short answer
US advance retail and food services sales estimate dollar receipts across covered businesses. The headline monthly figures adjust for seasonal, holiday and trading-day effects, but not changing prices. More dollars spent can therefore reflect higher prices, greater quantities or a different mix of purchases.
Identify what the retail headline covers.
The US Census Bureau: advance retail and food services sales releases publishes advance estimates of US retail and food services sales. These figures offer an early view of activity at covered businesses. They are not a complete measure of all household consumption: many services sit outside this retail and food-services coverage.
Do not confuse sales receipts with business profits, household disposable income or the number of products sold. US Census Bureau: retail survey definitions and coverage explains that businesses are classified by kind of business. A category for a type of store is not a pure measure of one product: that store can sell several kinds of goods.
Online selling is also a distribution channel, not proof that a purchase belongs outside consumption. Check the official category definition before making claims about how shoppers changed behaviour.
Distinguish more spending from more quantity.
The commonly reported adjusted retail figures account for seasonal, holiday and trading-day differences, but they are not adjusted for price changes. US Census Bureau: monthly retail time series and adjustments makes that distinction explicit. A higher petrol bill, for example, can reflect higher fuel prices without more fuel being purchased.
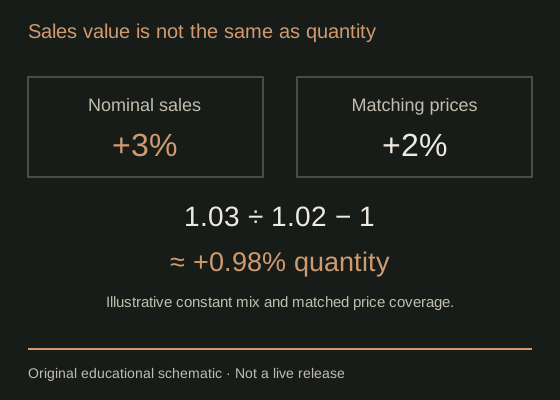
Consider a hypothetical single, unchanged basket. Nominal sales rise from USD 100 million to USD 103 million, while a perfectly matched basket price index rises from 100 to 102. The example deliberately assumes compatible coverage so the arithmetic isolates quantity.
| Measure | Calculation | Result |
|---|---|---|
| Nominal sales growth | (103 ÷ 100 − 1) × 100 | 3.00% |
| Price growth | (102 ÷ 100 − 1) × 100 | 2.00% |
| Current sales at base-period prices | USD 103 million ÷ 1.02 | USD 100.980392 million |
| Quantity growth under these assumptions | (1.03 ÷ 1.02 − 1) × 100 | 0.980392%, approximately 0.98% |
Subtracting 2% from 3% gives a one-percentage-point approximation, not the exact quantity calculation. Dividing the growth factors gives about 0.98%. For actual data, headline CPI is not automatically the appropriate deflator for every retail category: coverage, weights and timing must match. This exercise is not an official real-retail-sales series.
Read exclusions before comparing the numbers.
Calendars may show total sales, sales excluding motor vehicles, or other selected aggregates. Removing a volatile category answers a narrower question; it does not make the remaining number a complete measure of consumer spending or a guaranteed predictor of growth.
Suppose the total rises while a narrower aggregate falls. Both can be correct because their coverage differs. Read the industry table to identify which categories contributed rather than deciding that one row must be wrong.
Labels such as “core” or “control group” can require a provider-specific definition. Record the exact exclusions, adjustment and source series. Do not compare a forecast for sales excluding autos with an actual for sales excluding autos and petrol stations just because both appear beneath the headline.
Compare actual with a timestamped, matching forecast.
Imagine a completely hypothetical monthly sales increase of 0.6% against one calendar provider’s 0.3% consensus. The actual is 0.3 percentage point above that forecast. This is a difference between growth rates, not an additional 0.3% gain in the dollar or a prediction about the next month.
Suppose the prior month was initially reported as growing 0.4% but is revised to 0.1% in the same release. Save those two values separately. The current surprise and the weaker revised starting history can carry different information.
Consensus represents the named provider’s surveyed or compiled expectations, not an official Census prediction. Preserve its timestamp before the release. A forecast taken afterwards, or a calendar row that silently replaces the previous figure with its revision, cannot reconstruct exactly what was known beforehand.
Allow for estimation uncertainty and newer information.
The advance release is an estimate from a survey rather than a real-time census of every receipt. US Census Bureau: advance survey design and uses explains how the advance calculation uses a smaller early sample and the previous month’s preliminary estimate. Later information can change the picture.
Read the release’s uncertainty notes and confidence intervals. A small positive point estimate does not necessarily establish a statistically clear increase; a range including zero permits more than one interpretation of the underlying change. That uncertainty does not mean the published estimate is useless.
Monthly updates and US Census Bureau: historical annual retail revisions also matter when comparing history. Keep a dated release file for event analysis. Today’s revised series is useful for many economic questions, but it is not automatically the dataset available to traders on the original publication day.
Connect retail spending with the wider economy.
Retail sales inform consumption analysis, but they are not interchangeable with all PCE. BEA: consumer spending, prices and real PCE describes that broader measure. Census also identifies BEA as a user of retail estimates; an input to GDP compilation is not a one-for-one forecast of the final GDP growth rate.
A stronger retail release may alter views about demand and future monetary policy. Whether the dollar or gold rises depends on expectations, price changes, components, yields, positioning and other simultaneous information. A nominal increase driven by prices can tell a different story from a broad increase in quantities.
Read the CPI, employment and FOMC guides together when forming context. A plausible explanation after a move is not evidence that the release supplies a reliable trading rule. Check spreads and slippage before equating a chart move with a feasible fill.
Build a retail-release comparison sheet.
- Locate the release in the economic calendar and verify the Census publication.
- Record the reference month, units, adjustments and exact category exclusions.
- Save the source and timestamp of the comparable forecast.
- Separate actual, previous original and previous revised values.
- Read industry detail and uncertainty notes; state whether any price adjustment is your own calculation.
- Record market observations over a fixed window without treating correlation as proof of cause.
Explore related releases in the economic events centre. Sources checked 2 October 2026. The examples are hypothetical and contain no live release forecast.
Common retail-sales questions.
Are seasonally adjusted retail sales already adjusted for inflation?
No. Seasonal adjustment and price adjustment answer different questions. The headline Census retail figures are not adjusted for price changes.
Does a positive retail-sales figure prove consumers bought more goods?
No. Dollar receipts can increase through prices, quantities or changes in the mix of purchases. A compatible price measure is needed to separate these effects.
Is a calendar’s core-retail number the same as core inflation?
No. Core inflation excludes specified price categories. A narrower retail aggregate concerns sales coverage; verify its exact definition with the provider.
Sources & assumptions.
Prepared by InsomniCapital; see our editorial approach. Sources checked on 2 October 2026. Schematics and hypothetical calculations are labelled educational illustrations. Historical observations identify their source, dates and method separately. Neither is a live quote, trade recommendation or reported trading result.
- US Census Bureau: advance retail and food services sales releases.
- US Census Bureau: retail survey definitions and coverage.
- US Census Bureau: advance survey design and uses.
- US Census Bureau: monthly retail time series and adjustments.
- US Census Bureau: historical annual retail revisions.
- BEA: consumer spending, prices and real PCE.
Educational information only, not personalised investment advice. Leveraged trading carries a high risk of loss. Read our risk disclosure. InsomniCapital has an Axi affiliate relationship and may receive compensation for qualifying referrals. References are not endorsements of this guide.