Trading education · Reading the chart
Price action explained.
Candles, trends & levels.
Candles record what happened. Swings add structure. Neither tells you with certainty what comes next.
In this lesson
- Recognise a sequence of higher or lower swings.
- Identify when a confirmed swing actually becomes knowable.
Course outline
The complete course
8 modules. One clear path.
Follow the lessons in order, or return to a topic when you need it. Every lesson is open.
01Market foundations7 lessons · Not started
Start with quotes, orders, costs, exposure and the practical demands of a trading day.
- Read a currency quoteNot completed
- Choose an order instructionNot completed
- Identify the costs of executionNot completed
- Separate margin from riskNot completed
- Read account equity and closeout rulesNot completed
- Compare styles and commitmentsNot completed
- Read session times correctlyNot completed
02Stops, sizing and risk6 lessons · Not started
Connect price distances and contract assumptions to cash exposure, payoff and drawdown.
- Measure a stop distanceNot completed
- Calculate a position sizeNot completed
- Convert JPY pip valuesNot completed
- Include costs consistentlyNot completed
- Separate payoff from expectancyNot completed
- Understand recovery and loss sequencesNot completed
03Read price in context4 lessons · Not started
Work from completed observations to candles, zones and clearly stated pattern boundaries.
- Describe swings without hindsightNot completed
- Read the candle before the labelNot completed
- Mark and test a price zoneNot completed
- Define a chart pattern’s boundaryNot completed
04Understand indicator calculations3 lessons · Not started
Study what moving averages, RSI and MACD calculate before interpreting a signal.
- Compare SMA and EMANot completed
- Interpret RSI with its assumptionsNot completed
- Separate MACD from its histogramNot completed
05Gold products and calculations4 lessons · Not started
Identify the product, translate lots into ounces and work through results and position sizing.
- Identify the gold productNot completed
- Translate gold lots into ouncesNot completed
- Calculate a gold trade’s resultNot completed
- Translate gold lots into cash riskNot completed
06Economic releases and policy9 lessons · Not started
Read currency drivers, inflation, growth and policy announcements with their expectations and revisions.
- Study both sides of a currency pairNot completed
- Read an NFP releaseNot completed
- Compare like-for-like CPI figuresNot completed
- Compare PCE inflation measuresNot completed
- Read growth rates and revisionsNot completed
- Interpret a survey readingNot completed
- Separate spending from quantitiesNot completed
- Read the complete policy releaseNot completed
- Read beyond the FOMC headlineNot completed
07Build and test study rules5 lessons · Not started
Define a reproducible study, audit its assumptions and work through breakout, trend and range examples.
- Write a complete study specificationNot completed
- Audit a backtest before trusting itNot completed
- Account for a breakout’s executionNot completed
- Specify a trend-following studyNot completed
- Specify a range-trading studyNot completed
08Review decisions and evidence2 lessons · Not started
Review the process behind a result and the records needed to assess a performance claim.
- Review decisions as well as outcomesNot completed
- Assess signals and performance claimsNot completed
The short answer
Price action is the study of price movements over time. Candles, swing points and areas of prior reaction help describe a chart. Any decision rule built from them still needs explicit definitions, testing, costs and risk limits.
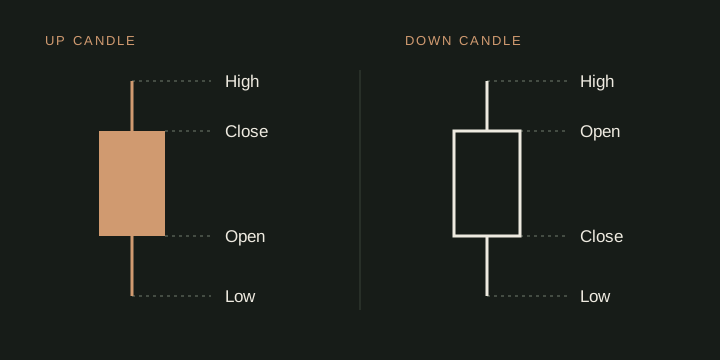
One candle. Four prices.
A candle represents an interval: for example, one minute, one hour or one day. Its body connects the opening and closing prices; the wick extends to the interval’s high and low. An up candle closes above its open, and a down candle closes below it. Colours depend on chart settings.
An unfinished candle can change shape before the interval ends. Also, open–high–low–close data do not tell you which extreme occurred first. A backtest using only candles must make an execution assumption if both a stop and target were touched inside one bar.
Describe the swings before naming the trend.
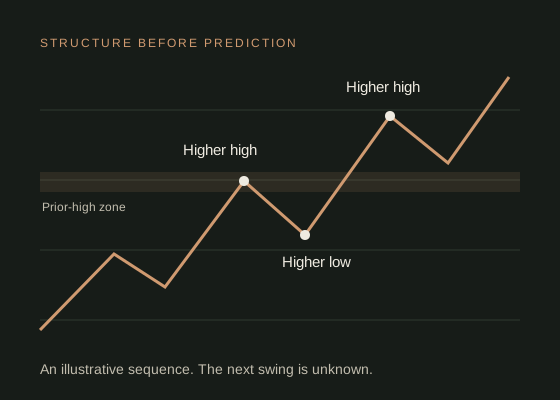
A rising sequence is commonly described through higher swing highs and higher swing lows. A falling sequence uses lower highs and lower lows. A range revisits an area without sustained progress in either direction.
The timeframe matters. A pullback on a daily chart can contain several falling swings on a five-minute chart. Write down the timeframe and the rule used to identify a swing before labelling a change of structure.
An example definition to test
Call a swing high “confirmed” only after two completed bars on each side have lower highs. That confirmation becomes available two bars later—not at the high itself.
This is an illustrative definition, not a recommended strategy. Using the later confirmation as though it were known at the earlier high introduces look-ahead bias.
Treat support and resistance as areas to investigate.
Support describes an area where a decline has previously met buying interest. Resistance describes an area where an advance has previously met selling interest. Prior highs, lows and repeated reactions are common reference points.
A thin line is a drawing choice, not proof that every participant values the same exact price. Use a consistent zone rule rather than widening the area after a trade loses. A former resistance area may later behave as support, but this role reversal can fail.
For a reproducible exercise, mark a previous session’s high and low before the next session begins. Record how price behaves on the first revisit. Keep every observation, including clean breaks and days with no revisit. This avoids selecting only the attractive examples after the outcome is known.
A break is an event, not confirmation of profit.
A wick beyond a level, a close beyond it and a later retest are different conditions. If your rule says “breakout”, define which one you mean. Also state the timeframe, distance threshold, order type and time window.
Imagine a prior high of 1.1050. A bar trades to 1.1054 and closes at 1.1048. A touch-based rule and a close-based rule reach different decisions. Neither becomes correct merely because the next candle moved in the desired direction.
A false break is a description applied when price returns after breaking a reference area. It is not necessarily knowable at the first crossing. Avoid explaining a losing entry with information that arrived only later.
Two candles, one explicit breakout rule.
Use a rule fixed before the outcome: a completed candle must close strictly above a prior high of 1.1050. The original diagrams below show two invented candles on the same price scale. They explain what satisfies that definition, not which trade would make money.
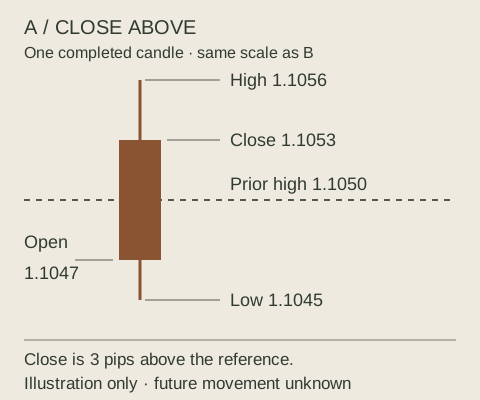
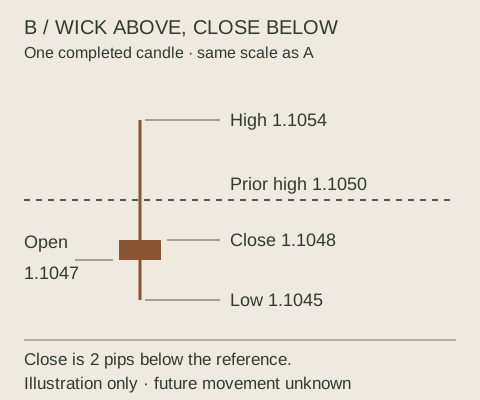
A touch-based rule would count both candles as crossings; the close-based rule counts only A. Specify the timeframe and quote side as well: a bid chart and an ask chart can cross a level at different times. A close exactly at 1.1050 would not satisfy the strictly-above condition.
Neither diagram includes the next candle. Using later price movement to label an earlier entry as “obviously valid” adds information that was not available then. Also, OHLC data alone cannot tell you whether the high or low occurred first within either candle.
Pattern names need measurable rules.
| Observation | What to define | What it cannot prove |
|---|---|---|
| Long wick | Wick-to-body ratio, location and timeframe. | That price must reverse. |
| Engulfing body | Whether bodies or full ranges must overlap. | That the following candle will continue. |
| Inside bar | Whether equal highs or lows are allowed. | Which side will break first. |
The purpose of a precise definition is to make observations comparable. A collection of labelled screenshots is not the same as a strategy evaluated on an unseen sample.
Turn a chart idea into an honest test.
- Freeze the rules. Define the market, timeframe, session, setup, entry, stop, exit and cancellation conditions.
- Use available information only. Account for swing-confirmation delays and incomplete candles.
- Model execution. Include bid/ask differences, commission, slippage and intrabar uncertainty.
- Separate development from evaluation. Keep data you did not use to tune the idea and record any later changes.
- Inspect the distribution. Review losses, drawdown, trade count and average net outcome—not just win rate.
Use position sizing to understand exposure. It can constrain a modelled trade loss; it does not turn an unprofitable entry rule into an edge.
Common questions.
Is price action better than indicators?
Neither label establishes performance. Many indicators transform the same price data. Compare specific rules on the same market, dates and cost assumptions.
Can a single candle predict the next move?
A candle records an interval, not a guaranteed future path. Any predictive claim requires evidence beyond a memorable example.
Why do charts differ between platforms?
Data feeds, bid/ask display, timezone boundaries and weekend handling can differ. Those differences can change candles and the patterns you label.
Sources & assumptions.
Prepared by InsomniCapital; see our editorial approach. Sources checked on 2 October 2026. Schematics and hypothetical calculations are labelled educational illustrations. Historical observations identify their source, dates and method separately. Neither is a live quote, trade recommendation or reported trading result.
- CME Group: chart construction and open–high–low–close data.
- CME Group: support and resistance concepts.
Educational information only, not personalised investment advice. Leveraged trading carries a high risk of loss. Read our risk disclosure. InsomniCapital has an Axi affiliate relationship and may receive compensation for qualifying referrals. References are not endorsements of this guide.
Lesson 14 checkpoint
Put the reading into practice
Work it through
Draw five completed bars and mark a proposed swing high. Add a rule requiring two later lower highs, and label the later moment when confirmation becomes available.
Completion records your study of this lesson. Read the evidence standards for how examples and claims are presented.