Trading education · Trading strategies
Forex Trading Strategies: A Practical Study Framework
Compare breakout, trend-following and range-trading strategies, define complete rules and evaluate costs, expectancy, drawdown and out-of-sample results.
In this lesson
- State entry, exit, expiry, execution and cost assumptions.
- Keep development choices separate from an untouched evaluation sample.
Course outline
The complete course
8 modules. One clear path.
Follow the lessons in order, or return to a topic when you need it. Every lesson is open.
01Market foundations7 lessons · Not started
Start with quotes, orders, costs, exposure and the practical demands of a trading day.
- Read a currency quoteNot completed
- Choose an order instructionNot completed
- Identify the costs of executionNot completed
- Separate margin from riskNot completed
- Read account equity and closeout rulesNot completed
- Compare styles and commitmentsNot completed
- Read session times correctlyNot completed
02Stops, sizing and risk6 lessons · Not started
Connect price distances and contract assumptions to cash exposure, payoff and drawdown.
- Measure a stop distanceNot completed
- Calculate a position sizeNot completed
- Convert JPY pip valuesNot completed
- Include costs consistentlyNot completed
- Separate payoff from expectancyNot completed
- Understand recovery and loss sequencesNot completed
03Read price in context4 lessons · Not started
Work from completed observations to candles, zones and clearly stated pattern boundaries.
- Describe swings without hindsightNot completed
- Read the candle before the labelNot completed
- Mark and test a price zoneNot completed
- Define a chart pattern’s boundaryNot completed
04Understand indicator calculations3 lessons · Not started
Study what moving averages, RSI and MACD calculate before interpreting a signal.
- Compare SMA and EMANot completed
- Interpret RSI with its assumptionsNot completed
- Separate MACD from its histogramNot completed
05Gold products and calculations4 lessons · Not started
Identify the product, translate lots into ounces and work through results and position sizing.
- Identify the gold productNot completed
- Translate gold lots into ouncesNot completed
- Calculate a gold trade’s resultNot completed
- Translate gold lots into cash riskNot completed
06Economic releases and policy9 lessons · Not started
Read currency drivers, inflation, growth and policy announcements with their expectations and revisions.
- Study both sides of a currency pairNot completed
- Read an NFP releaseNot completed
- Compare like-for-like CPI figuresNot completed
- Compare PCE inflation measuresNot completed
- Read growth rates and revisionsNot completed
- Interpret a survey readingNot completed
- Separate spending from quantitiesNot completed
- Read the complete policy releaseNot completed
- Read beyond the FOMC headlineNot completed
07Build and test study rules5 lessons · Not started
Define a reproducible study, audit its assumptions and work through breakout, trend and range examples.
- Write a complete study specificationNot completed
- Audit a backtest before trusting itNot completed
- Account for a breakout’s executionNot completed
- Specify a trend-following studyNot completed
- Specify a range-trading studyNot completed
08Review decisions and evidence2 lessons · Not started
Review the process behind a result and the records needed to assess a performance claim.
- Review decisions as well as outcomesNot completed
- Assess signals and performance claimsNot completed
The short answer
A forex strategy is a complete, testable process: market, timeframe, setup, entry, invalidation, exit, sizing and execution rules. A named pattern or indicator is only one component. The examples in this collection are study specifications with no claimed profitable track record.
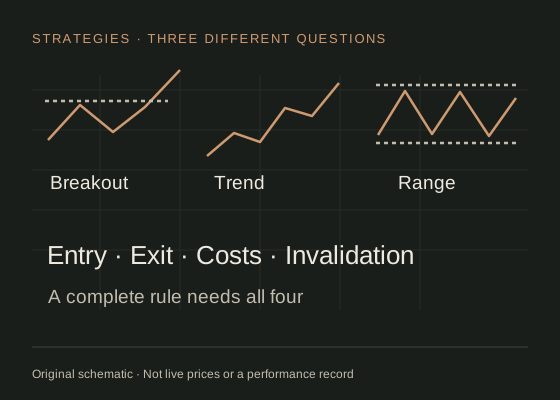
Start with the hypothesis.
| Family | Question being tested | Failure to include |
|---|---|---|
| Breakout | Does price continue after leaving a defined boundary? | False breaks, adverse gaps and entry after much of the move. |
| Trend following | Does an existing directional tendency persist? | Sideways whipsaws, delayed entry and a sudden reversal. |
| Range trading | Does a bounded area keep containing price? | A genuine breakout and repeated attempts to fade a new trend. |
The breakout, trend-following and range guides each provide an explicit educational specification. They are alternatives to evaluate, not three opportunities that must always be traded together.
Support/resistance and moving-average concepts are explained by Fidelity: support, resistance and role reversal and Fidelity: exponential moving averages. Our numerical parameters and example rule combinations are original teaching choices; the sources do not validate them.
Write a complete rulebook.
- Universe and data: instrument, provider feed, timezone, bid/ask fields and handling of missing observations.
- Context: the measurable market condition that makes a setup eligible.
- Signal: the exact completed observation required.
- Execution: order type, submission time, expiry and possible non-fill.
- Exit: initial stop, target, time exit and any subsequent changes.
- Risk: position-size calculation, costs, margin checks and total concurrent exposure.
- Exclusions: dealing breaks, scheduled news, excessive spreads and unreliable quotes.
If two people following the rules would regularly choose different trades, refine the definitions before comparing results. Vague phrases such as “strong candle” and “obvious support” need explicit criteria if they determine entries.
A good-looking ratio is not an edge.
Suppose an invented sample contains 100 trades: 40 wins of 2R and 60 losses of 1R, before costs. Gross total is 80R − 60R = 20R, or 0.20R per trade. If each round trip costs 0.25R, net total becomes −5R, or −0.05R per trade.
This arithmetic demonstrates cost sensitivity; it is not a backtest. A 2:1 target alone does not tell you how often it fills, how often losses exceed the planned stop, or how the sequence affects drawdown. Use the risk/reward calculator to check a scenario and the drawdown calculator to explore recovery arithmetic.
Keep R defined consistently. If one sample defines R before commission and another after costs, their headline results are not directly comparable. Preserve raw cash results and exposures as well as normalised measures.
Separate development from evaluation.
Use one historical period to develop the rule, then freeze it before evaluating a different period. A later forward observation or demo sample adds information about execution and operational mistakes. No split guarantees that future conditions will resemble either sample.
Record every parameter combination tried. Choosing the best result from many variants and presenting it as the outcome of one preselected method understates the amount of selection involved. Do not repeatedly consult the holdout sample and still call it untouched.
Check for lookahead: future-confirmed swings, revised macroeconomic data, and indicators calculated using the unfinished higher-timeframe candle can all introduce information unavailable at the trade timestamp. The issue is what was knowable when the order would have been placed.
Model the inconvenient cases.
A candle can contain both a stop and target without revealing which was reached first. Use suitably granular data or an explicitly conservative ambiguity rule; never assume the favourable order just because it improves results.
Use executable sides of quotes and a commission schedule consistent with the product. Stress test wider spreads and worse fills, and distinguish a rejected or unfilled order from a losing filled trade. Investor.gov: order execution risks (securities examples) explains basic order limitations in a securities context; confirm the actual rules for your forex provider.
Include financing when positions cross the provider's relevant cutoff, and review margin independently of the planned stop loss. A method that requires unavailable trade sizes or unsupported orders is not executable merely because its spreadsheet balances.
What a useful result report contains.
Report the dates, instrument, feed, timeframe, rule version, number of observations and all cost assumptions. Summarise net expectancy, drawdown, outcome distribution and losing streaks, not only win rate. Explain missing data, ambiguous fills and the number of variations considered.
A decision not to proceed is a valid research outcome. If reasonable execution costs erase the apparent advantage, the useful conclusion is that the tested specification has not established a viable edge. Do not hide that result behind a cleaner-looking chart.
Work through it yourself.
Record the plan, execution assumptions, outcome and lessons from a practice trade.
Download trading-review worksheet PDF · 2 pagesFree to download without registering. Practice examples explain the method; they do not establish a profitable strategy.
Common strategy questions.
What is the most profitable forex strategy?
This collection does not establish one. Profitability depends on exact rules, market conditions, costs and execution, and cannot be inferred from a strategy name.
How many trades prove a strategy works?
There is no universal number. Independence, regime coverage, selection effects and the size and variability of outcomes matter alongside sample size.
Can I use these example rules immediately?
They are unvalidated teaching specifications. Use them to understand testing and execution, not as a recommendation to place live trades.
Sources & assumptions.
Prepared by InsomniCapital; see our editorial approach. Sources checked on 2 October 2026. Schematics and hypothetical calculations are labelled educational illustrations. Historical observations identify their source, dates and method separately. Neither is a live quote, trade recommendation or reported trading result.
- Fidelity: support, resistance and role reversal.
- Fidelity: exponential moving averages.
- Investor.gov: order execution risks (securities examples).
Educational information only, not personalised investment advice. Leveraged trading carries a high risk of loss. Read our risk disclosure. InsomniCapital has an Axi affiliate relationship and may receive compensation for qualifying referrals. References are not endorsements of this guide.
Lesson 34 checkpoint
Put the reading into practice
Work it through
Write a one-page hypothetical rulebook containing instrument, timeframe, completed-data rule, entry, stop, target, expiry, costs and no-trade conditions. List any remaining ambiguity.
Completion records your study of this lesson. Read the evidence standards for how examples and claims are presented.