Trading education · Trading indicators
EMA vs SMA: Moving Averages Explained with Examples
Compare exponential and simple moving averages, calculate each with worked numbers, and understand lag, crossovers, settings and sideways-market failures.
In this lesson
- Calculate a simple average from stated closes.
- Explain weighting, seed history and the limits of a crossover.
Course outline
The complete course
8 modules. One clear path.
Follow the lessons in order, or return to a topic when you need it. Every lesson is open.
01Market foundations7 lessons · Not started
Start with quotes, orders, costs, exposure and the practical demands of a trading day.
- Read a currency quoteNot completed
- Choose an order instructionNot completed
- Identify the costs of executionNot completed
- Separate margin from riskNot completed
- Read account equity and closeout rulesNot completed
- Compare styles and commitmentsNot completed
- Read session times correctlyNot completed
02Stops, sizing and risk6 lessons · Not started
Connect price distances and contract assumptions to cash exposure, payoff and drawdown.
- Measure a stop distanceNot completed
- Calculate a position sizeNot completed
- Convert JPY pip valuesNot completed
- Include costs consistentlyNot completed
- Separate payoff from expectancyNot completed
- Understand recovery and loss sequencesNot completed
03Read price in context4 lessons · Not started
Work from completed observations to candles, zones and clearly stated pattern boundaries.
- Describe swings without hindsightNot completed
- Read the candle before the labelNot completed
- Mark and test a price zoneNot completed
- Define a chart pattern’s boundaryNot completed
04Understand indicator calculations3 lessons · Not started
Study what moving averages, RSI and MACD calculate before interpreting a signal.
- Compare SMA and EMANot completed
- Interpret RSI with its assumptionsNot completed
- Separate MACD from its histogramNot completed
05Gold products and calculations4 lessons · Not started
Identify the product, translate lots into ounces and work through results and position sizing.
- Identify the gold productNot completed
- Translate gold lots into ouncesNot completed
- Calculate a gold trade’s resultNot completed
- Translate gold lots into cash riskNot completed
06Economic releases and policy9 lessons · Not started
Read currency drivers, inflation, growth and policy announcements with their expectations and revisions.
- Study both sides of a currency pairNot completed
- Read an NFP releaseNot completed
- Compare like-for-like CPI figuresNot completed
- Compare PCE inflation measuresNot completed
- Read growth rates and revisionsNot completed
- Interpret a survey readingNot completed
- Separate spending from quantitiesNot completed
- Read the complete policy releaseNot completed
- Read beyond the FOMC headlineNot completed
07Build and test study rules5 lessons · Not started
Define a reproducible study, audit its assumptions and work through breakout, trend and range examples.
- Write a complete study specificationNot completed
- Audit a backtest before trusting itNot completed
- Account for a breakout’s executionNot completed
- Specify a trend-following studyNot completed
- Specify a range-trading studyNot completed
08Review decisions and evidence2 lessons · Not started
Review the process behind a result and the records needed to assess a performance claim.
- Review decisions as well as outcomesNot completed
- Assess signals and performance claimsNot completed
The short answer
An SMA gives equal weight to the prices in its lookback window. An EMA gives greater weight to recent prices while retaining older information through a recursive calculation. Both lag price; greater responsiveness also means greater sensitivity to short-term noise.
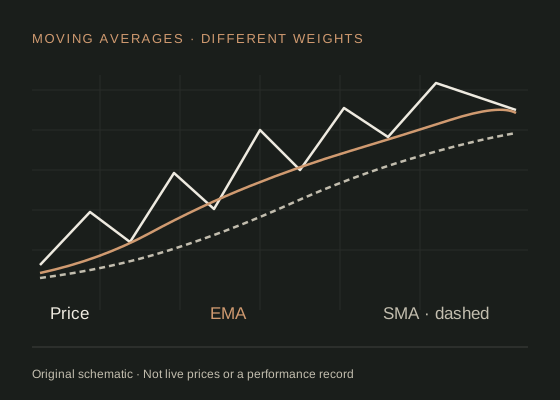
How a simple moving average works.
A simple moving average is the arithmetic mean of a fixed number of observations. A five-period SMA of closing prices adds the latest five closes and divides by five. When a new close arrives, the oldest observation leaves the window.
Fidelity: simple moving averages describes that rolling calculation. A 20-period setting means 20 candles on the selected chart. It does not identify a universal duration unless the timeframe is also specified.
SMA(n) = sum of the latest n prices ÷ n
For the hypothetical closes 100, 102, 101, 103 and 104, the five-period SMA is 102. If the next close is 110, the new window is 102, 101, 103, 104 and 110, giving an SMA of 104. The result changes because a new value entered and an old value left.
How an exponential moving average differs.
Fidelity: exponential moving averages explains the greater emphasis on recent prices. A common EMA convention uses a coefficient of 2 ÷ (n + 1), with the previous EMA carrying the remaining weight.
α = 2 ÷ (n + 1)
EMA now = α × price now + (1 − α) × previous EMA
Seed a five-period EMA with the first five-close SMA of 102 from the example above. The coefficient is 1/3. When the next close is 110, the new EMA is 102 + (110 − 102) ÷ 3 = 104.6667. In this example the EMA has moved further towards the new close than the SMA of 104.
That comparison is only valid with the initialisation stated. Some platforms start an EMA at the first observation, while others seed it from an SMA or use more history. An EMA retains a diminishing influence from older observations rather than discarding everything beyond the nominal lookback.
Compare the trade-offs.
| Feature | SMA | EMA |
|---|---|---|
| Weights | Equal within a fixed window. | Largest on the newest observation, declining into the past. |
| Old prices | Leave the calculation when the window moves. | Continue with progressively smaller influence. |
| Response to a new shock | Spread across the selected window. | Typically quicker for an equivalent period setting. |
| Weakness | Can react slowly and change as old extremes drop out. | Can respond repeatedly to short-lived price noise. |
Choosing the faster line does not solve the timing problem. An earlier apparent signal may also be an earlier false signal. The relevant comparison is the behaviour of the whole rule after costs, not which coloured line looks closer to the most recent turning point.
What slopes and crossovers can tell you.
A rising moving average describes an upward tendency in its inputs. Price above the line describes the current price relative to that smoother history. A fast average crossing a slow average describes a change in their ordering. These are three different observations; none supplies a complete trading plan.
For a hypothetical study, define an upward crossover as the fast average being at or below the slow average on the previous completed candle and strictly above it on the current completed candle. That prevents repeatedly counting every bar above the line as a new crossover.
The corresponding failure example is a sideways series that moves alternately above and below both averages. Repeated entries can lose through whipsaws and transaction costs, even if the market ends near its starting price. Increasing the lookback may reduce some crossings while delaying others; it is not a free improvement.
Use a moving average as one defined component.
The trend-following example uses an EMA as a context filter with a separate price trigger and exit. That separation makes the role of each condition reviewable. Calling a line “dynamic support” should not imply it physically prevents price moving through it.
Before comparing results, record the price field, timeframe, lookback, averaging method, warm-up period and execution time. If a rule uses today's close, it cannot assume it entered earlier at that same day's low. A close-based signal usually requires a later tradable price unless a supported close-execution mechanism is explicitly modelled.
Check the cost allowance and compare an untouched evaluation sample. A visually appealing 20/50 or 50/200 crossover on one historical chart is not evidence that those settings are optimal across instruments.
Work through it yourself.
Follow RSI, moving-average and MACD calculations using an editable practice price series.
Download indicator calculation workbook Excel workbook · editable formulasFree to download without registering. Practice examples explain the method; they do not establish a profitable strategy.
Common moving-average questions.
Is EMA better than SMA?
Neither is universally better. They weight history differently. Compare them within a specified rule, dataset and execution model, rather than judging only the smoothness of the line.
What is the best moving average for day trading?
This guide does not establish an optimal lookback. Shorter horizons make costs and execution more consequential, and parameter selection should be tested on data not used to choose it.
Does a moving average predict future prices?
It transforms past and current observations. A trading hypothesis based on that transformation still needs evidence beyond the formula itself.
Sources & assumptions.
Prepared by InsomniCapital; see our editorial approach. Sources checked on 2 October 2026. Schematics and hypothetical calculations are labelled educational illustrations. Historical observations identify their source, dates and method separately. Neither is a live quote, trade recommendation or reported trading result.
- Fidelity: simple moving averages.
- Fidelity: exponential moving averages.
- CME Group: chart types and OHLC data.
Educational information only, not personalised investment advice. Leveraged trading carries a high risk of loss. Read our risk disclosure. InsomniCapital has an Axi affiliate relationship and may receive compensation for qualifying referrals. References are not endorsements of this guide.
Lesson 18 checkpoint
Put the reading into practice
Work it through
Calculate the three-close SMA for 100, 102 and 104. In the downloadable workbook, change one input and observe how the SMA and EMA respond differently.
Completion records your study of this lesson. Read the evidence standards for how examples and claims are presented.