Trading education · Trading indicators
RSI Indicator Explained: Formula, Levels and Divergence
Understand the RSI formula, 30 and 70 levels, Wilder smoothing and divergence. Work through an example and learn where RSI interpretations fail.
In this lesson
- Relate RSI to smoothed gains and losses.
- Separate a threshold observation from a reversal forecast.
Course outline
The complete course
8 modules. One clear path.
Follow the lessons in order, or return to a topic when you need it. Every lesson is open.
01Market foundations7 lessons · Not started
Start with quotes, orders, costs, exposure and the practical demands of a trading day.
- Read a currency quoteNot completed
- Choose an order instructionNot completed
- Identify the costs of executionNot completed
- Separate margin from riskNot completed
- Read account equity and closeout rulesNot completed
- Compare styles and commitmentsNot completed
- Read session times correctlyNot completed
02Stops, sizing and risk6 lessons · Not started
Connect price distances and contract assumptions to cash exposure, payoff and drawdown.
- Measure a stop distanceNot completed
- Calculate a position sizeNot completed
- Convert JPY pip valuesNot completed
- Include costs consistentlyNot completed
- Separate payoff from expectancyNot completed
- Understand recovery and loss sequencesNot completed
03Read price in context4 lessons · Not started
Work from completed observations to candles, zones and clearly stated pattern boundaries.
- Describe swings without hindsightNot completed
- Read the candle before the labelNot completed
- Mark and test a price zoneNot completed
- Define a chart pattern’s boundaryNot completed
04Understand indicator calculations3 lessons · Not started
Study what moving averages, RSI and MACD calculate before interpreting a signal.
- Compare SMA and EMANot completed
- Interpret RSI with its assumptionsNot completed
- Separate MACD from its histogramNot completed
05Gold products and calculations4 lessons · Not started
Identify the product, translate lots into ounces and work through results and position sizing.
- Identify the gold productNot completed
- Translate gold lots into ouncesNot completed
- Calculate a gold trade’s resultNot completed
- Translate gold lots into cash riskNot completed
06Economic releases and policy9 lessons · Not started
Read currency drivers, inflation, growth and policy announcements with their expectations and revisions.
- Study both sides of a currency pairNot completed
- Read an NFP releaseNot completed
- Compare like-for-like CPI figuresNot completed
- Compare PCE inflation measuresNot completed
- Read growth rates and revisionsNot completed
- Interpret a survey readingNot completed
- Separate spending from quantitiesNot completed
- Read the complete policy releaseNot completed
- Read beyond the FOMC headlineNot completed
07Build and test study rules5 lessons · Not started
Define a reproducible study, audit its assumptions and work through breakout, trend and range examples.
- Write a complete study specificationNot completed
- Audit a backtest before trusting itNot completed
- Account for a breakout’s executionNot completed
- Specify a trend-following studyNot completed
- Specify a range-trading studyNot completed
08Review decisions and evidence2 lessons · Not started
Review the process behind a result and the records needed to assess a performance claim.
- Review decisions as well as outcomesNot completed
- Assess signals and performance claimsNot completed
The short answer
RSI compares smoothed upward and downward price changes on a bounded 0–100 scale. High readings describe strong recent upward movement relative to downward movement. They do not mean price must reverse or that a short position is justified.
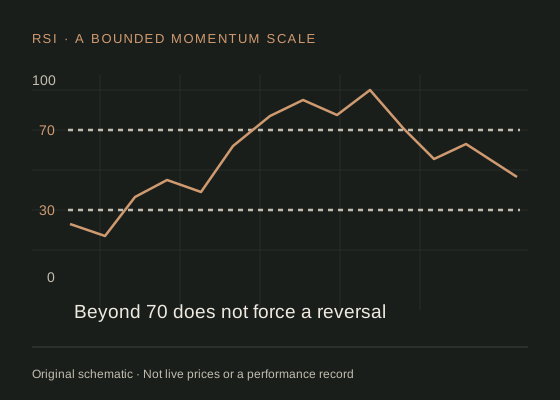
What RSI measures.
The Relative Strength Index, associated with J. Welles Wilder, summarises the balance between recent gains and losses in the same instrument. It does not compare that instrument with a market benchmark, despite the words “relative strength”. The commonly used lookback is 14 periods; on an hourly chart that means 14 hourly changes, not 14 days.
Fidelity: RSI definition and calculation describes the indicator and the conventional 30 and 70 reference levels. Those levels are descriptive thresholds. Price can continue falling with a low RSI, or continue rising with a high RSI, so “oversold” is not synonymous with undervalued.
Use completed observations when studying a close-based rule. RSI on the current candle moves as that candle's price changes. A momentary crossing that disappears before the close is different from a confirmed close-based crossing.
Calculate RSI and understand the smoothing.
RS = average gain ÷ average loss
RSI = 100 − 100 ÷ (1 + RS)
For a conventional 14-period Wilder calculation, begin with 14 consecutive price changes, requiring 15 closes. Separate each change into a non-negative gain and a non-negative loss magnitude. The first averages are the arithmetic means of those 14 values.
For later observations, update each average as (previous average × 13 + new value) ÷ 14. This differs from recalculating a rolling simple average each time. It also differs from the usual EMA coefficient 2 ÷ (n + 1). Confirm the method used by your platform before comparing values.
If average loss is zero and average gain is positive, the limiting RSI value is 100; if gain is zero and loss is positive, it is 0. If both are zero, the formula is indeterminate, and software conventions can differ. Initialisation and the amount of warm-up history can also cause small discrepancies.
An original numerical example.
Suppose the current smoothed average gain is 1.5 price units and average loss is 0.5. RS is 3, making RSI 75. These are arbitrary price-change units, not a live instrument quote.
The next close falls by 2 units. The new gain is zero and the new loss is 2. Applying a 14-period Wilder update gives an average gain of (1.5 × 13) ÷ 14 = 1.392857 and an average loss of (0.5 × 13 + 2) ÷ 14 = 0.607143. RSI becomes approximately 69.64.
The indicator has crossed below 70 after one decline. That arithmetic does not tell us whether the next close will be higher or lower. It demonstrates how the current change interacts with the existing smoothed history, which is why a fixed price move does not always create the same RSI change.
Distinguish levels, momentum and divergence.
| Observation | What it records | What it does not prove |
|---|---|---|
| Above 70 / below 30 | An extreme balance of recent gains versus losses under this setting. | That the current trend is finished. |
| Crossing 50 | Smoothed gains and losses changing relative balance. | A profitable timing rule after costs. |
| Bearish divergence | A higher price high alongside a lower RSI high. | The timing or size of a reversal. |
| Bullish divergence | A lower price low alongside a higher RSI low. | That a falling market has reached its final low. |
For a divergence study, define which completed swings are being compared and when they became identifiable. Connecting whichever two points look best after a reversal produces a persuasive picture but an unusable test.
A useful counterexample is a trend that makes three successive higher highs while RSI makes lower highs. A trader who shorts each divergence may take repeated losses before any reversal occurs. Keep that possibility in the explanation, rather than showing only the final successful turn.
Choose a question before changing the settings.
A shorter lookback responds to fewer observations; a longer lookback smooths over more history. Neither is inherently the best setting for forex, gold or a particular timeframe. Changing both the timeframe and lookback changes the question you are asking.
For an educational comparison, keep one price dataset fixed and examine 7-, 14- and 21-period RSI using the same smoothing and warm-up method. Record how frequently each crosses a threshold, how many crossings reverse promptly, and what the complete entry/exit rule would cost. Reserve a later, untouched period for evaluation.
Avoid treating MACD and RSI agreement as two independent votes. Both are transformations of price history. A separate observation about execution costs or an approaching scheduled economic release may answer a different question more usefully.
Work through it yourself.
Follow RSI, moving-average and MACD calculations using an editable practice price series.
Download indicator calculation workbook Excel workbook · editable formulasFree to download without registering. Practice examples explain the method; they do not establish a profitable strategy.
Common RSI questions.
Is RSI above 70 a sell signal?
It is a conventional high-reading threshold, not an instruction. Strong trends can keep RSI elevated. A trading rule needs separate entry, exit, invalidation and cost assumptions.
Why does my RSI differ from another chart?
Compare the instrument feed, timeframe, closing prices, lookback, smoothing, warm-up history and whether the current bar is complete. Matching only the label “RSI 14” may not match all inputs.
Can RSI predict a reversal?
RSI describes historical changes. A divergence or threshold crossing can be a hypothesis for study, but this guide provides no predictive accuracy or profitability claim.
Sources & assumptions.
Prepared by InsomniCapital; see our editorial approach. Sources checked on 2 October 2026. Schematics and hypothetical calculations are labelled educational illustrations. Historical observations identify their source, dates and method separately. Neither is a live quote, trade recommendation or reported trading result.
- Fidelity: RSI definition and calculation.
- TradingView: RSI smoothing implementation.
- Fidelity: exponential moving averages.
Educational information only, not personalised investment advice. Leveraged trading carries a high risk of loss. Read our risk disclosure. InsomniCapital has an Axi affiliate relationship and may receive compensation for qualifying referrals. References are not endorsements of this guide.
Lesson 19 checkpoint
Put the reading into practice
Work it through
Use average gain 1.5 and average loss 0.5 to calculate RSI. Write why the resulting value alone cannot decide the next price direction.
Completion records your study of this lesson. Read the evidence standards for how examples and claims are presented.