Trading education · Portfolio risk
Forex Correlation and Combined Currency Exposure
See how two forex trades can repeat the same currency exposure. Calculate a USD exposure ledger and distinguish correlation from a risk guarantee.
In this lesson
- Decompose hypothetical pair positions into their currency directions.
- Separate summed planned stop losses from historical correlation and maximum possible loss.
Course outline
The complete course
8 modules. One clear path.
Follow the lessons in order, or return to a topic when you need it. Every lesson is open.
01Forex trading fundamentals10 lessons · Not started
Check brokers, rehearse a demo workflow, then study quotes, orders, costs, exposure and the demands of a trading day.
- Forex trading for beginnersNot studied
- How to Check a Forex Broker’s RegulationNot studied
- How to Use a Forex Demo AccountNot studied
- Forex order typesNot studied
- How to Place, Manage and Close a Forex TradeNot studied
- Spreads, slippage and swapsNot studied
- Margin and leverageNot studied
- Margin calls and stop-outsNot studied
- Day trading, swing trading and scalpingNot studied
- Forex market hoursNot studied
02Position sizing and risk management7 lessons · Not started
Connect price distances, contract assumptions and combined currency exposure to cash risk, payoff and drawdown.
- Stop-loss distances in pipsNot studied
- EUR/USD position sizingNot studied
- JPY pip valuesNot studied
- Position sizing with trading costsNot studied
- Forex Correlation and Combined Currency ExposureNot studied
- Risk-reward ratiosNot studied
- Drawdown and recoveryNot studied
03Price action and chart patterns5 lessons · Not started
Work from completed observations to candles, zones, multiple timeframes and clearly stated pattern boundaries.
- Price action tradingNot studied
- Candlestick patternsNot studied
- Support and resistanceNot studied
- Multiple Timeframe Analysis in ForexNot studied
- Chart patternsNot studied
04Trading indicators3 lessons · Not started
Study what moving averages, RSI and MACD calculate before interpreting a signal.
- Moving averages: EMA and SMANot studied
- RSI indicatorNot studied
- MACD indicatorNot studied
05Gold trading and XAU/USD4 lessons · Not started
Identify the product, translate lots into ounces and work through results and position sizing.
- Gold trading for beginnersNot studied
- Gold contract sizes and lot sizesNot studied
- Gold profit and lossNot studied
- Gold position sizingNot studied
06Economic indicators and central banks9 lessons · Not started
Read currency drivers, inflation, growth and policy announcements with their expectations and revisions.
- Central banks and currency pricesNot studied
- Nonfarm payrolls (NFP)Not studied
- CPI inflationNot studied
- PCE inflationNot studied
- GDP growth and revisionsNot studied
- PMI explainedNot studied
- Retail sales explainedNot studied
- Central bank decisionsNot studied
- FOMC meetingsNot studied
07Forex strategies and backtesting5 lessons · Not started
Define a reproducible study, audit its assumptions and work through breakout, trend and range examples.
- Forex trading strategiesNot studied
- Backtesting trading strategiesNot studied
- Breakout trading strategiesNot studied
- Trend-following strategiesNot studied
- Range trading strategiesNot studied
08Trading psychology and signals2 lessons · Not started
Review the process behind a result and the records needed to assess a performance claim.
- Trading psychologyNot studied
- Forex signals explainedNot studied
The short answer
Count the currencies behind all open positions, not only the number of pairs. Long EUR/USD and long GBP/USD both carry a short-USD direction. Historical correlation describes a sample of returns; it does not guarantee that positions offset or cap losses.
Read both sides of every pair.
A buy in EUR/USD has the direction of long EUR and short USD. A sell has the opposite direction. These currency legs are a useful notional representation for understanding a derivative; they do not mean a retail CFD account literally receives both cash balances.
The CME Group: identifying and managing currency exposure shows why identifying the source of currency exposure matters. Here we apply the same basic idea to a small hypothetical trading ledger, without recommending a hedge or trading strategy.
Writing “two separate trades” can hide a shared dependency. If both trades need USD to weaken, a broad USD strengthening can hurt both. Separate charts and entry signals do not remove that common exposure.
Build a notional currency ledger.
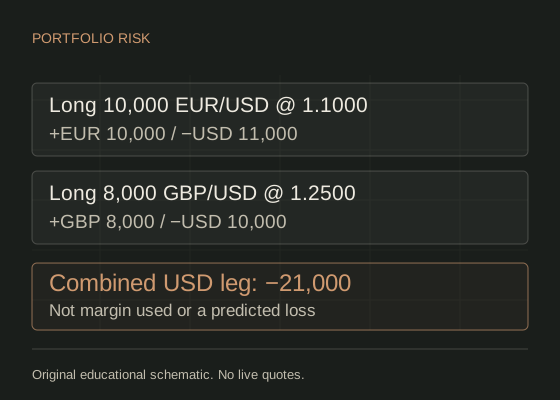
Assume a long 10,000 EUR/USD position entered at 1.1000 and a long 8,000 GBP/USD position entered at 1.2500. Ignore costs for this exposure illustration. Multiply base units by the quote to find the quote-currency leg at the stated entry.
| Position | EUR leg | GBP leg | USD leg |
|---|---|---|---|
| Long 10,000 EUR/USD at 1.1000 | +10,000 | 0 | −11,000 |
| Long 8,000 GBP/USD at 1.2500 | 0 | +8,000 | −10,000 |
| Combined notional direction | +10,000 | +8,000 | −21,000 |
The −USD 21,000 leg describes the combined directional exposure at entry. It is not margin used, a predicted loss or an amount necessarily borrowed in your account. EUR and GBP remain different exposures, and this simple ledger does not include financing, nonlinear products or a changing conversion rate for a non-USD account.
If the GBP/USD position were instead a short 8,000 GBP, its USD leg would be +USD 10,000. The net USD leg would become −USD 1,000, while +EUR 10,000 and −GBP 8,000 remain. That changes the portfolio; it does not make it risk-free.
Stress both positions together.
For the original two long positions, suppose EUR/USD moves from 1.1000 to 1.0950 and GBP/USD from 1.2500 to 1.2450. Assume both can close at those stated prices in the USD account. This is a selected hypothetical scenario, not a forecast or probability estimate.
| Position | Calculation | Price P/L |
|---|---|---|
| EUR/USD long | 10,000 × (1.0950 − 1.1000) | −USD 50.00 |
| GBP/USD long | 8,000 × (1.2450 − 1.2500) | −USD 40.00 |
| Combined | −USD 50.00 − USD 40.00 | −USD 90.00 |
With hypothetical equity of USD 5,000, that price loss is 1.80% of starting equity. Add any separate costs. Other price combinations could produce different outcomes, and a gap can bypass a chosen stop level.
Suppose planned stop losses were USD 50 and USD 40, with an assumed USD 3 of total separate costs. Their sum is USD 93, or 1.86% of USD 5,000. This is a planned scenario under stated execution assumptions, not a maximum possible loss. Do not reduce the sum merely because a correlation estimate looked favourable.
Measure returns, with a defined sample.
Correlation describes how two numerical series moved together over a chosen sample. For pair prices, a common choice is matching periodic returns, such as r = current price ÷ previous price − 1. Record the interval, dates, quote direction, missing-data treatment and whether returns are simple or logarithmic.
A Pearson correlation near +1 indicates closely aligned linear movements in that sample; near −1 indicates opposing movements; near zero indicates little linear relationship. Zero does not mean independence, and a constant return series makes the coefficient undefined.
A 20-observation estimate and a 120-observation estimate answer different sample questions. Correlations can change. Position direction also matters: buying both positively correlated pairs and buying one while selling the other are different exposures. Contract size and volatility still affect the cash result.
Do not calculate correlation from trending price levels and interpret it as if it were return correlation. Do not fill a missing quote with a fabricated zero return simply to make rows align.
Use historical evidence with its limitations.
The historical FX correlation and volatility lab uses a disclosed historical reference-rate sample or a compatible uploaded CSV. It is not a live portfolio monitor. Match the sample and instrument to the question before using the result.
The ECB: reference exchange rates and their information-only purpose publishes daily reference observations for information; they are not executable bid/ask quotes. Daily data cannot reveal intraday stop sequences, spread widening or the fills a broker would have offered.
- List all positions with direction, units and account currency.
- Write the notional currency legs at stated quotes.
- Add planned losses and separate costs under explicit fill assumptions.
- Stress shared currency moves, gaps and changes in correlation.
- Compare the exposures with the written plan before adding another position.
There is no universal safe percentage or correlation threshold supplied here. The task is to make the assumptions and common exposures visible.
Common questions.
Are EUR/USD and GBP/USD always positively correlated?
No. Any estimate belongs to a stated sample and return convention. Relative EUR and GBP developments can change their relationship.
Does a negative correlation guarantee a hedge?
No. The relationship may change, the sizes and volatilities may differ, and execution costs or gaps can prevent an intended offset.
Is total planned stop risk the maximum possible loss?
No. It assumes fills at the stated levels and costs. Slippage, gaps, rejected instructions and other events can produce a different result.
Sources & assumptions.
Prepared by InsomniCapital. Sources checked on . The workflows, fictional entities, diagrams and numerical examples are original teaching illustrations. They are not reported trades, current quotes or a tested strategy. Product and platform conditions vary.
- CME Group: identifying and managing currency exposure
- ECB: reference exchange rates and their information-only purpose
Educational information, not personalised investment advice. Leveraged trading carries a high risk of loss. InsomniCapital has an Axi affiliate relationship and may receive referral compensation. Sources are not endorsements of this guide. Read our risk disclosure and editorial standards.
Lesson 15 checkpoint
Put the reading into practice
Work it through
Rebuild the two-position currency ledger and the joint loss scenario in this guide. Then reverse the GBP/USD position and explain which USD exposure reduces and which EUR/GBP-related risk remains. State why historical correlation is insufficient to guarantee a hedge.
The checkbox records study; answering every checkpoint question correctly records a separate pass. Try the module assessment for a mixed question set. Read the evidence standards for how examples and claims are presented.