Trading education · Chart context
Multiple Timeframe Analysis in Forex
Combine higher-timeframe context with a lower-timeframe trigger, using completed candles and an explicit timeline to avoid look-ahead bias.
In this lesson
- Assign separate context and trigger rules to stated chart intervals.
- Identify which higher-timeframe close was actually available at an earlier decision.
Course outline
The complete course
8 modules. One clear path.
Follow the lessons in order, or return to a topic when you need it. Every lesson is open.
01Forex trading fundamentals10 lessons · Not started
Check brokers, rehearse a demo workflow, then study quotes, orders, costs, exposure and the demands of a trading day.
- Forex trading for beginnersNot studied
- How to Check a Forex Broker’s RegulationNot studied
- How to Use a Forex Demo AccountNot studied
- Forex order typesNot studied
- How to Place, Manage and Close a Forex TradeNot studied
- Spreads, slippage and swapsNot studied
- Margin and leverageNot studied
- Margin calls and stop-outsNot studied
- Day trading, swing trading and scalpingNot studied
- Forex market hoursNot studied
02Position sizing and risk management7 lessons · Not started
Connect price distances, contract assumptions and combined currency exposure to cash risk, payoff and drawdown.
- Stop-loss distances in pipsNot studied
- EUR/USD position sizingNot studied
- JPY pip valuesNot studied
- Position sizing with trading costsNot studied
- Forex Correlation and Combined Currency ExposureNot studied
- Risk-reward ratiosNot studied
- Drawdown and recoveryNot studied
03Price action and chart patterns5 lessons · Not started
Work from completed observations to candles, zones, multiple timeframes and clearly stated pattern boundaries.
- Price action tradingNot studied
- Candlestick patternsNot studied
- Support and resistanceNot studied
- Multiple Timeframe Analysis in ForexNot studied
- Chart patternsNot studied
04Trading indicators3 lessons · Not started
Study what moving averages, RSI and MACD calculate before interpreting a signal.
- Moving averages: EMA and SMANot studied
- RSI indicatorNot studied
- MACD indicatorNot studied
05Gold trading and XAU/USD4 lessons · Not started
Identify the product, translate lots into ounces and work through results and position sizing.
- Gold trading for beginnersNot studied
- Gold contract sizes and lot sizesNot studied
- Gold profit and lossNot studied
- Gold position sizingNot studied
06Economic indicators and central banks9 lessons · Not started
Read currency drivers, inflation, growth and policy announcements with their expectations and revisions.
- Central banks and currency pricesNot studied
- Nonfarm payrolls (NFP)Not studied
- CPI inflationNot studied
- PCE inflationNot studied
- GDP growth and revisionsNot studied
- PMI explainedNot studied
- Retail sales explainedNot studied
- Central bank decisionsNot studied
- FOMC meetingsNot studied
07Forex strategies and backtesting5 lessons · Not started
Define a reproducible study, audit its assumptions and work through breakout, trend and range examples.
- Forex trading strategiesNot studied
- Backtesting trading strategiesNot studied
- Breakout trading strategiesNot studied
- Trend-following strategiesNot studied
- Range trading strategiesNot studied
08Trading psychology and signals2 lessons · Not started
Review the process behind a result and the records needed to assess a performance claim.
- Trading psychologyNot studied
- Forex signals explainedNot studied
The short answer
Give each timeframe a defined job, use only information available at the decision time and decide what happens when the charts disagree. A higher-timeframe filter and a lower-timeframe trigger describe a research rule; they do not establish a profitable strategy.
Give every chart a specific job.
A timeframe is the interval represented by one bar or candle. Looking at H4 and M15 means aggregating the same market into four-hour and fifteen-minute observations, not consulting two independent markets. MetaTrader 5: chart timeframes, prices and data windows explains timeframe controls and chart construction.
| Role | Example interval | Question to write down |
|---|---|---|
| Context | H4 | Where are the zones and what completed observations define the context? |
| Trigger | M15 | What exact completed-bar event would permit a hypothetical entry? |
| Management | Specified in advance | Which price or time condition ends the idea, regardless of chart switching? |
The intervals are examples, not recommended settings. Choose them to match a research question and available data. More chart windows do not automatically add evidence, particularly when they repeat the same underlying move.
Know when a candle becomes available.
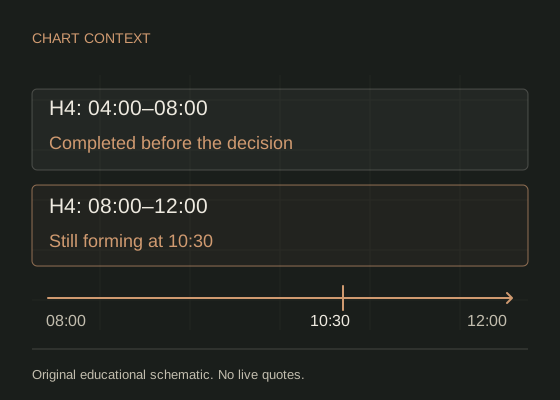
Assume H4 bars start at 00:00, 04:00, 08:00 and 12:00 in one clearly stated platform clock. At 10:30, the 08:00–12:00 candle is still forming. Its final high, low and close do not yet exist. The most recent completed H4 candle is 04:00–08:00.
| Observation | Available for a completed-bar rule? |
|---|---|
| H4 candle 04:00–08:00 | Yes: this candle has ended. |
| H4 candle 08:00–12:00 | No: its final values are future information. |
| M15 candle 10:15–10:30 | Yes, after completion and data arrival. |
| M15 candle 10:30–10:45 | No: it has only just started. |
The MetaQuotes MQL5: current and completed bar data distinguishes current, unfinished bar data from completed observations. A historical chart may now show the final H4 candle beside the earlier M15 signal; using that final value at 10:30 would introduce look-ahead bias.
In live systems, do not assume a candle appears exactly on the wall-clock boundary without a new quote. Confirm the data timestamp and platform convention. Broker time zones, daylight saving and trading breaks can change the candle boundaries used by different feeds.
Write a complete, hypothetical rule.
Imagine that, before 10:30, completed H4 observations defined a study zone from 1.1000 to 1.1010. The researcher recorded this zone before seeing the subsequent reaction. This example is an original schematic, not a backtest or current setup.
- Context: retain the zone while the latest completed H4 close is at or above 1.1000.
- Trigger: after a visit to the zone, require a completed M15 close above 1.1010.
- Cancellation: if the next completed H4 close falls below 1.1000 before entry, cancel the idea.
- Execution: estimate the next available ask for a hypothetical buy, including costs; do not assume the M15 closing price is an available fill.
- Risk: define the protective price, size and permitted loss before evaluating the result.
At 10:30, a completed M15 close of 1.1012 would meet the illustrative trigger only if the other recorded conditions held. A later H4 close cannot retroactively cancel an earlier observation or be used to justify it. It can affect a new decision once it is known.
Decide what disagreement means.
A lower-timeframe decline can be a pullback within a higher-timeframe rise. That is not a data error. Specify whether your study skips conflicting cases, permits a defined countertrend variant or waits for another completed observation. Record skipped cases too.
A poor rule is to keep changing intervals until one supports a desired trade. It makes the selection depend on the outcome you want. A reproducible rule states the intervals, price basis and cancellation logic first.
Do not move an invalidation level merely because a larger chart provides a more comfortable-looking boundary. For an unchanged size, a wider stop increases planned price risk. Reassessing risk and choosing not to trade are valid decisions.
Audit a replay without future information.
- Choose one feed and state its time zone and bid, ask, midpoint or last-price basis.
- Save the higher-timeframe observations available at each decision time.
- Hide later candles while writing the context, trigger and cancellation decision.
- Record the earliest possible execution after the trigger, with costs and gaps.
- Reveal later data and score rule adherence separately from the outcome.
The backtesting guide explains how to keep rule development separate from evaluation. Test whether the extra timeframe improves the specific study after costs; visual agreement alone does not answer that question.
Common questions.
Is H4 with M15 the best combination?
There is no universally best combination established here. The intervals are a teaching example; any performance claim needs a defined rule, appropriate data and evaluation after costs.
Can I use an unfinished candle?
You can define an intrabar rule, but it is a different rule and requires information available at that moment. You cannot replace the partial observation with the final historical candle.
Why do two platforms show different daily candles?
Check the feed, price basis, time zone, session boundary and daylight-saving convention. Different aggregation boundaries can create different candles from overlapping trading periods.
Sources & assumptions.
Prepared by InsomniCapital. Sources checked on . The workflows, fictional entities, diagrams and numerical examples are original teaching illustrations. They are not reported trades, current quotes or a tested strategy. Product and platform conditions vary.
- MetaTrader 5: chart timeframes, prices and data windows
- MetaQuotes MQL5: current and completed bar data
Educational information, not personalised investment advice. Leveraged trading carries a high risk of loss. InsomniCapital has an Axi affiliate relationship and may receive referral compensation. Sources are not endorsements of this guide. Read our risk disclosure and editorial standards.
Lesson 21 checkpoint
Put the reading into practice
Work it through
At a hypothetical 10:30 decision, label the completed H4 and M15 bars you may use. Write a context rule, trigger, invalidation and disagreement rule before revealing later candles. Explain why the eventual 12:00 H4 close is unavailable.
The checkbox records study; answering every checkpoint question correctly records a separate pass. Try the module assessment for a mixed question set. Read the evidence standards for how examples and claims are presented.